Posts

Showing posts from May, 2008

Time for a pause?

Image
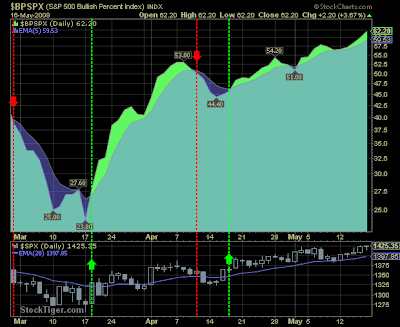
Before each of my market posts there is a buy/sell call (at owner's risk!). At the start of the month I usually try to call the flavour for the coming month based on overall market conditions; which I have marked on the chart below. What is clear is having waited so long for the market to roll over (basically spent most of 2007 waiting), I jumped too early on the bullish bandwagon this year. The past 3-months have been good for bulls. Like in late 2006 there is a reasonable chance June will be another upward month. However, it is unusual to get sequence runs beyond 4 months. Look at the early 2006 decline, late 2006 advance, early 2007 advance and the late 2007/early 08 decline; all lasted around 4 months. What we are likely to see after June is a period of sideways trading until the next 3/4 month sequence kicks in. June will likely be the last month I keep my 'Buy' call on the market. Get the Fallond Newsletter Dr. Declan Fallon, Senior Market Technician, Zignals.com th

Essential Reading

The market didn't do a whole lot yesterday, so I took a look at what is going on in the blogosphere. (Via TraderMike ): Dr.Duru has some worrying analysis on the financials, GE and others. The GE chart looks real scary if your bullish the market. HeadlineCharts has gone the other direction and is watching for a bullish head-and-shoulder reversal in the XLF; $24 support is key in this regard. Dug this from TraderMike's archive: Gold ETF demand increases as it decreases for the precious metal. Another from the archive: Know What's in your ETF and How the ETF is Calculated . (via Abnormal returns ) FT-Alphaville: Bear or Superbear (via Abnormal returns) The case for dividends . (via Abnormal returns) Afraid-to-trade has highlighted two new blogs ; Skill Analytics and Trading Bots . Jamie at Wall Street Warrior has a Head-and-Shoulder top marked in for the Nasdaq. Watch the converged support lines closely (c2,425) Timothy Sykes book now on iTunes . I know, I know Tim, I

Zignals: Building Blog Relationships

I have my latest post based on Problogger's 12 Tools and Techniques for Building Relationships with Other Bloggers up on the Zignals Blog . http://zignalsblog.blogspot.com/2008/05/building-blog-relationships.html Dr. Declan Fallon, Senior Market Technician, Zignals.com the free stock alerts, market alerts and stock charts website

Bullish Percents all in the red - intermediate down trend in play

Image
May 21st saw the bullish percents of the Nasdaq and S&P follow that of the Dow with a bearish cross of the 5-day EMA. The S&P compounded the loss with a break of rising support connected by March-April dips using closing price. Overall, these breadth indicators haven't fully reached typical tops for either a bull or bear market. If the cyclical bull market is still in play - which I don't think it is - then these can move much higher before a top is signalled. Get the Fallond Newsletter Dr. Declan Fallon, Senior Market Technician, Zignals.com the free stock alerts, market alerts and stock charts website

StockCharts.com Weekly review

Image
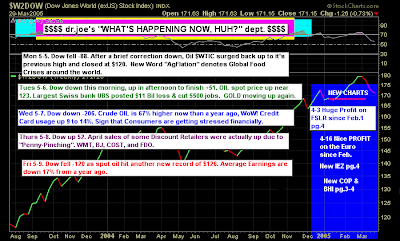
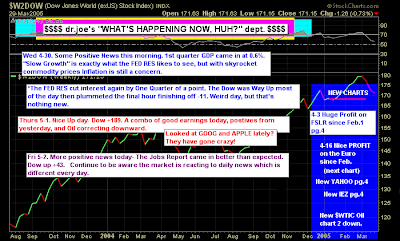
With the long weekend in play there wasn't much updating activity amongst the Stockcharters, but it was a busy week for the market. Dr. Joe was sick during the week, so no update from him. His oil watch is interesting because it looks like there is a bull trap for Exxon Mobil (XOM): Maurice Walker is looking for the Dark Cloud Pattern in oil to bear fruit. Another great epic from Maurice, although I don't agree with everything he says here - his market analysis is top notch: Spotting distinct sell signals can be difficult if you just use one form of technical analysis. But when you combine candlesticks, volume, chart patterns, moving averages, and some personal preference indicators, it can lead to a high probability of catching a change in price direction . On Monday prices broke above the 200-day SMA on the major indexes, but by the end of the day the rally had fizzled. This produced a gravestone doji on the S&P 500 and a inverted hammer on the DJIA. The sell signals we

New KIVA loans

Image
I have a couple more Subscriber payments to allocate to new KIVA loans, but first I want to re-loan some earlier payments. First loan goes to Adama Hagbegno , a baker in Togo. Born on 31 December 1975 in Amégnran, Mr. Adama HAGBEGNO is married and has eight (8) children. His bakery is his source of income, and is highly sought after by many women because he is the sole breadmaker in his area. This high income business allows him to meet the needs of his family and especially the education of his children. To strengthen his capital base and better satisfy his clientele, he is asking for a loan. This will serve to stock a large quantity of wheat flour. The realization of this dream will allow him to maintain his clientele and to enlarge it. Thus, his income will increase, allowing his family to flourish. The second re-loan goes to Suliha in Indonesia: Since moving to Bali in 1994, Suliha has wanted to work, but she faced a reality that to find a job is very difficult. That was why the

Important test for the Nasdaq

Image
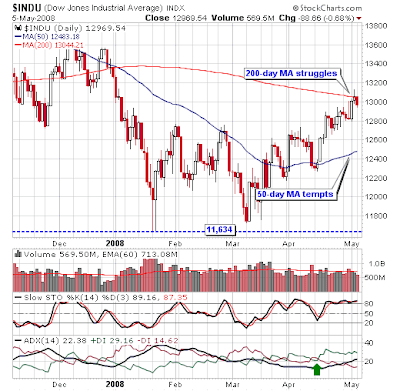
Four days ago I was talking about the break of the 200-day MA on strong money flow. Today it's about a test of March-April support with money flow shrinking fast. When the index created the second reaction low in April it coincided (somewhat) with a test of the 50-day MA. Another test of this average would see a new trendline develop, but it is by no means certain. The other point of interest has been the continued weakness in the Dow Bullish Percents. May 8th saw an intermediate 'Sell' trigger which wasn't reversed when the index made its second challenge on the 200-day MA. Keep an eye on Fib retracement levels for the breadth indicator (and how it reflects on the parent index): More downside looks the more likely option in the near term. Get the Fallond Newsletter Declan Fallon is developing trading strategies, market indicators and sentiment tools for Zignals

Latest Zignals post: Blog traffic and market reversals

Image
Over at the Zignals blog I have completed a brief study comparing on-balance-visits (yes, "visits") to the S&P. Teaser chart below:

Posting issues

A frustrating day using Blogger. Looks like third party ISP users are getting the shaft with Blogger's FTP feature. Usually Blogger are fairly good at correcting these issues but this one has dragged - am I the only one to suffer? I have a free stock pick up on my parent site. If you are looking for the free stock picks this is the best place to start. I don't post stocks on a regular basis, although subscribers do get all picks by email via PDF - so they don't need to check back regularly to find updates. My daily market commentary is also available on the parent site home page. Annotated charts are kept on Stockcharts.com Public list for those who prefer their information visually. Other Bloggers to maintain public Stockchart lists are Danny Merkel at Goldstockprophet , Chris Perruna at Chrisperruna.com , Dane Jacobsen at Ecostocktrader.com , Hector Rivera at Rsstockcycles , and Bill Rempel at Bill Rempel, a.k.a. NO DooDahs! . Someone who I thought had Public S

Transports vertigo?

Image
On my parent website I have focused more on the main lead markets with the charts hosted by Stockcharts.com . The Dow theorists will want to take a look at the Transport Index. Monday saw a large inverse (bearish) hammer on heavy volume. Contributing to the toppy look was the stochastic 'sell' at overbought conditions and the extended nature of bullish trend strength. I have redrawn Fib retracements from before . I am liking the convergence of the 50% retracement and the 200-day MA as a downside target. Get the Fallond Newsletter Declan Fallon is developing trading strategies, market indicators and sentiment tools for Zignals

Stockcharts.com weekly review

Image
Another week for the Stockcharters to take a look at the market. Richard Crockett has taken a (very) similar route to me on the bullish percents: But does have a nice bull/bear chart for the S&P: Dr. Joe remains bullish on Agriculture: The US Dept of AGRICULTURE reported the 'Corn Harvest' is 7% lower than last year. They estimate the price of corn will go up another 30% this year. The cost of 'Feed' has already increased so much that farmers have cut back production of chickens and pigs. Basically this means the vast corn-chicken-pig related food products will keep going higher. Agriculture remains bullish. Joe gets his ConocoPhillips (COP) breakout, will Exxon Mobil Corp (XOM) be next? Ribbons on the rise (bullish): The Maurice homily - he is edging towards short positions, but advises caution: This market continues to hold up, despite recent selling pressures at resistance. The S&P 500 and the SPY broke out of inverse head and shoulders pattern today on th

Tech is where the fun is.

Image
I had noted back in early December how the semiconductor index was due a bounce following some heavy overselling. It responded by falling even further to January lows, but was able to stabilize and rally back to its 200-day MA. During the run to the 200-day MA it has barely paused for breath, and bullish trend strength has been steadily increasing [+DI > -DI; ADX at 30 and rising]. This boundless energy has translated into a positive 2 months for tech averages: Money flow is very positive and the break of the 200-day MA should be enough to extend the rally a little further, as it has done in the Nasdaq 100: But Bill over at VixandMore makes a good case for at least taking some profits off the table . Get the Fallond Newsletter Declan Fallon is developing trading strategies, market indicators and sentiment tools for Zignals

Dow top?

Image
The Dow bullish percents look to indicate a top in the short term. I am watching Fibonacci retracements, which based on prior 'sell' triggers and Fibonacci interceptions suggest downside targets of 12,583 or 12,296. Markets off to a relatively quiet start. Opinion Polls  &  Market Research Get the Fallond Newsletter Declan Fallon is contributing to the development of stock alerts, stock charts, and trading strategies for Zignals

Where next?

At the start of February after breadth indicators reached all-time lows I gave a guesstimate as to what the S&P would do over the coming months. Other than the larger than expected dip in March it has remained relatively ontrack: But where does the market go next? S&P Breadth indicators are getting a little toasty which favors some modicum of weakness over the coming weeks. This would shake out the weak hands and leave the index better prepared for an upside break of the 200-day MA. The alternative is a straight break and run - with barely a pause at the 200-day MA. Get the Fallond Newsletter

Feedback request: Alerts

I'm looking for a quick-and-dirty feedback request for market alerts. "Market Alerts" encompass price alerts (e.g. stock price alerts), stock fundamentals (e.g. P/E drops to 10), portfolio alerts (e.g. a stock holding in my portfolio drops by $200). Opinion Polls  &  Market Research Use the comments section to add your wishlist for market alerts (type, frequency, subject matter, etc....). Don't hold back on what you would consider the 'dream list' of features you would want for an alert. Particularly if what you want is not currently available, or you are someone who doesn't use alerts but would if you could do x, y and z. Also consider delivery options; email is the main one, but what about iphone, sms, twitter? Would you use alerts if they could be routed to you in different ways? Your wish may come true and it won't cost a you a penny to get it!

What holds for Copper prices?

Image
What goes for copper, goes for technology stocks (and the market as a whole). After what looked to be a triple top for the commodity in 2007, the ever weakening dollar helped push an upside breakout of $375. Broadening wedges are hard to spot and if this is what's at play then a move back to $250 would appear the best case for the metal. However, as long as $375 holds then a run-of-the-mill breakout is to hand, with a projected target closer to $500 than $250. Election years are traditionally viewed as bullish for the market. However, the previous two have been anything but. The protracted Democratic nomination doesn't help given it's only the warm-up to the main event. Wall Street hates uncertainty and it's by no mean clear cut who has the edge coming into November (irrepsective of who wins the Democractic nomination). Political uncertainty and a strengthening dollar, both painted on the background of a weak global environment, suggests copper prices are likely to fall

Stockcharts.com Weekly Review

Image
May as well try and get a review post up before Monday's open. Feeling very sleepy... 2 hrs sleep on a red-eye is not good for the soul. Dr. Joe raises the issue of "Agflation". Interesting thought - but I think commodities have peaked for this stage of the bull cycle, although the best may yet be to come. Joe is looking at a potential breakout for oil companies - but commodity-based stocks tend to lead commodity prices, so if they fail to break it would be bad news for oil: Not marked, but there is a 'sell' trigger in the Dow's PPO: Maurice Walker has jumped up the league table - his weekly review is worth the price of entry. Maurice looking for a breather in the markets, his closing paragraph pretty much echoes what I think will play out. Follow his link to get his charts: There was contest held a while back called the wacky warning label contest. Second prize in the competition went to a certain warning that was written on a kitchen knife that said 'n

Next update next week

Back from Washington D.C. next week - update then.

Bullish Percents getting a little toasty

Image
Although not of immediate concern, some of the bullish percents are about to enter bear market (but not bull market) top territory. If January lows represent the start of a bear market then these breadth indicators should top soon. If the current rally is a continuation of the cyclical bull market then there is room for another 15-20% of gain (perhaps as much as 50% for the Nasdaq Bullish Percents). How this impacts on the market remains to be seen, but the likely outcome would be a negative divergence between breadth indicators and the market; indices make new highs as bullish percents fall. Time will tell. I'm traveling to D.C. so there will be no update tomorrow. INS appointment Friday. Get the Fallond Newsletter

Zignals blog post

Image
Running tight for time, but I do have a strategy test post for on-balance-volume up on the Zignals blog . As for the markets, the Dow has perhaps the most interest given the struggles at its 200-day MA. Can it follow the lead of the Nasdaq 100? Although it may have its own problems given the 'Hanging Man' just after its 200-day MA break. Both indices show healthy bull trends as measured by ADX. Get the Fallond Newsletter

Stockcharts.com weekly review

Image
Running a little late on everything this weekend. The MSFT-YHOO fun and games may have some dampening influence on proceedings for Monday, but how went the week? Dr. Joe is watching daily machinations: Although the dollar is attempting a run of strength (which will hurt gold prices); oil looks to have found a point of strength: He has called a breakout in the Dow: Ted Burge is watching the Q's. A positive test of support? The point-n-figure chart is looking for $53.59 off the May 1st Ascending Triple Top Breakout: Maurice Walker has called an end to the correction. His fan chart shows it nicely: Maurice's commentary is a(nother) good one, although I disagree with him on the market not closing in bear market territory; in January of this year breadth indicators reached levels comparable to Sept 11th and the Asian Currency Crisis. We may have got strong bull markets from them, but the action which led to these lows was certainly bearish. However,

Archive

Show more