Posts

Showing posts from June, 2019

Russell 2000 Stages Recover

Image
A much needed boost to Small Caps gave value buyers a shot in the arm as the Russell 2000 gained nearly 2%, returning it above 200-day and 50-day MAs. It was an important recovery which wasn't quite mirrored by peer indices, but such indices are in much better shape.

Small Cap Weakness Spreads

Image
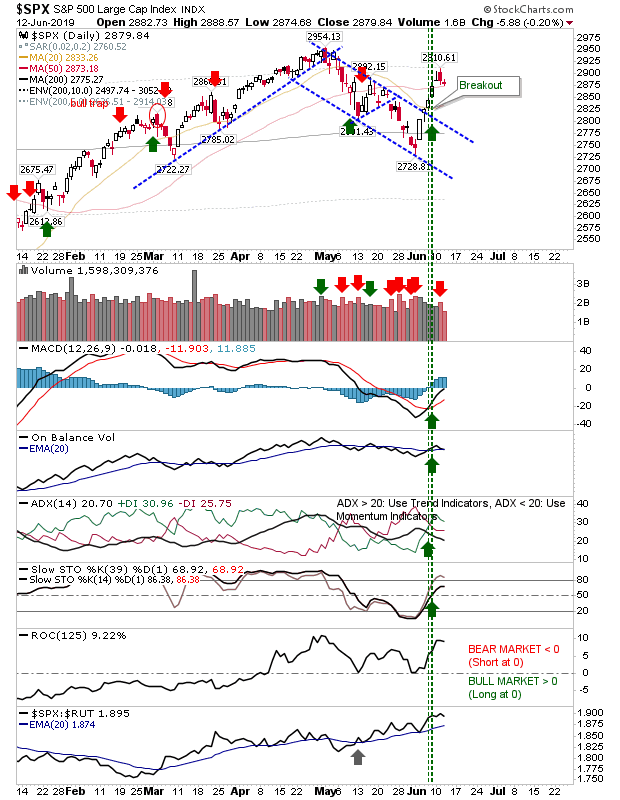
Sellers took a third day of selling out of the Russell 2000 and this weakness made its way to the S&P and Nasdaq. The selling is more problematic for the Russell 2000 because there is a genuine lack of conviction from traders wanting to pick up an index which is trading at a deep discount to its peers.

Neutral Friday although Russell 2000 wobbles

Image
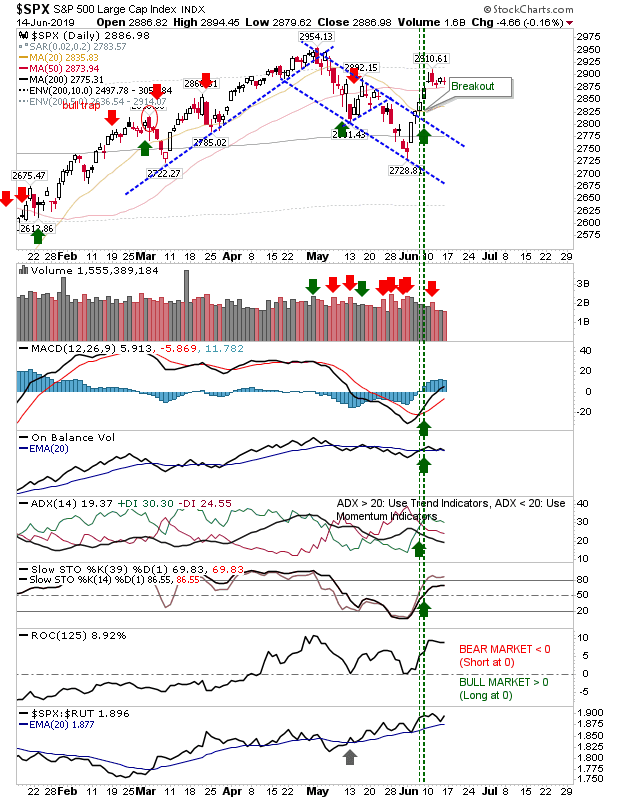
Options expiration skewed volume action but it was a relatively neutral day.  Only the Russell 2000 suggested a more bearish undertone existed in the market. The S&P is currently probing its April high so it's of no surprise to see a small 'gravestone' doji appear on this test. I would be happy to see a small consolidation handle (ideally holding the 50-day MA) as a preparation for a push to new all-time highs but don't be surprised if the market doesn't wait for this. This rally has merit with excellent relative performance and an accumulation trend in volume.

Markets Consolidate Tuesday's Gains

Image
It's looking like markets are keen to challenge April highs. The narrow consolidations which built up over last week was cleared by Tuesday's gains and held these highs by Wednesday's close. For the S&P, this came with an accumulation day. Other technicals are net bullish.

Small Gains Continue Market Consolidations

Image
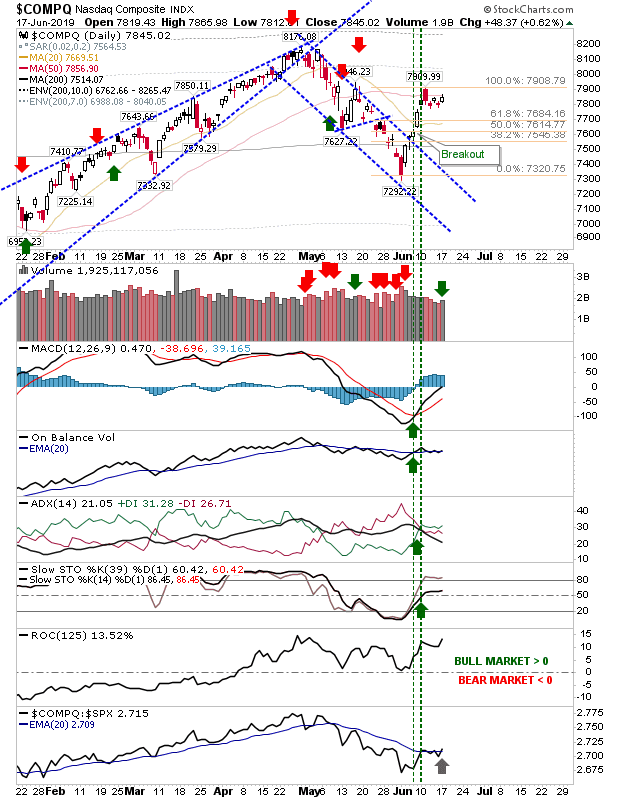
Not a whole lot offered by indices, but what was offered had more bullish overtones than negative. The Nasdaq continued with its shaping of a bullish handle. Volume climbed a little in registering an accumulation day. The index still has to put some distance from its 50-day MA but once it does and mounts a challenge on April highs it could really pick up momentum. On a more subtle note, there was an uptick in relative performance.

Gains Consolidate in Markets

Image
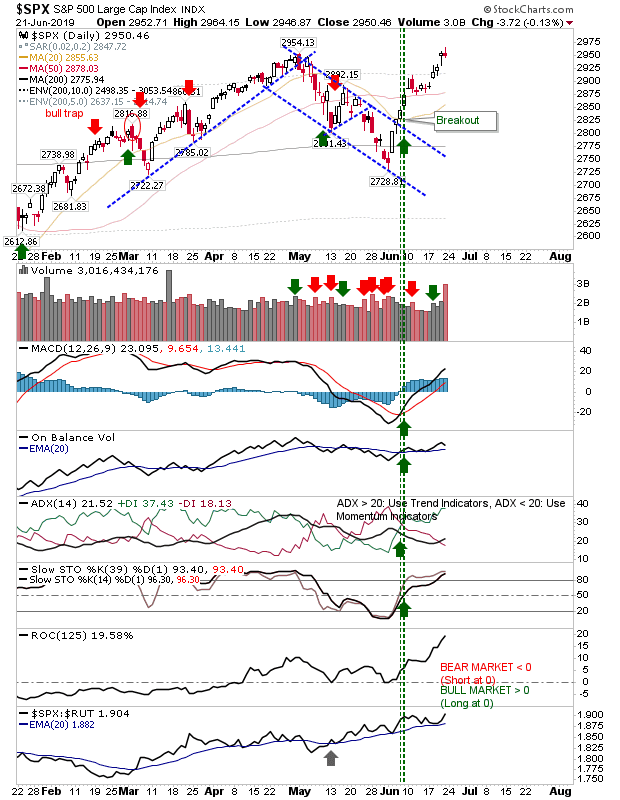
Friday's action was positive because so little happened. Markets had spent the first half of June rallying off lows, but last week was one where indices consolidated the gains. Not all indices were equal, but the effect was the same. The S&P closed with a doji - a doji which held above 50-day MA support. Volume declined in line with the consolidation; a positive behavior. Technicals are still net positive. Action points to a probable follow through higher and a challenge of the 52-week high of 2,954.

Kx Product Insights: Technical analysis of financial markets, what’s it all about?

One of my pieces I wrote for the Kx Systems Insights blog: "For this month’s blog post we will delve into the mysteries of technical analysis of financial markets.  Kx Dashboards come with two built-in financial charting packages which can be used to demonstrate technical analysis. In this article we will use the Financial Chart component. Our next article will look at some of the tools in ChartIQ." Read More

Net Bullish Technicals for S&P and Nasdaq

Image
Since the last update we have seen significant technical improvement, even if the indices registered losses over the last couple of days. The S&P is now resting near its 50-day MA but there may not be sufficient wiggle room for it to be held as support. If this was to fail then next would be former channel resistance now support.

S&P and Nasdaq confirm breakouts; rallies start to build

Image
The S&P and Nasdaq were last to follow the lead of the Russell 2000, Dow and Semiconductor Index. It's now looking like respectable swing lows are in effect for all lead indices. For the S&P there was a close above the 50-day MA in addition to the follow through breakout. Technicals returned net bullish, making the 52-week high of 2,954 as the next challenge for the index.

Breakouts for Russell 2000, Semiconductors and Dow Industrials

Image
It was a bit of a mixed bag, although the basis for a probable swing low for markets is in place. Best of the action was in the Semiconductor Index where there was a clear break from the downward channel, which also coincided with a return above the 200-day MA. The consolidation below - and move above - the 200-day MA has the makings of a 'bear trap'. Next challenge is getting past the 20-day MA and if it can do this on the back of a MACD trigger 'buy' it will set things nicely for a challenge of the 50-day MA, then a larger challenge of the 52-week high at 1,604.

Nasdaq Suffers Heavy Selling

Image
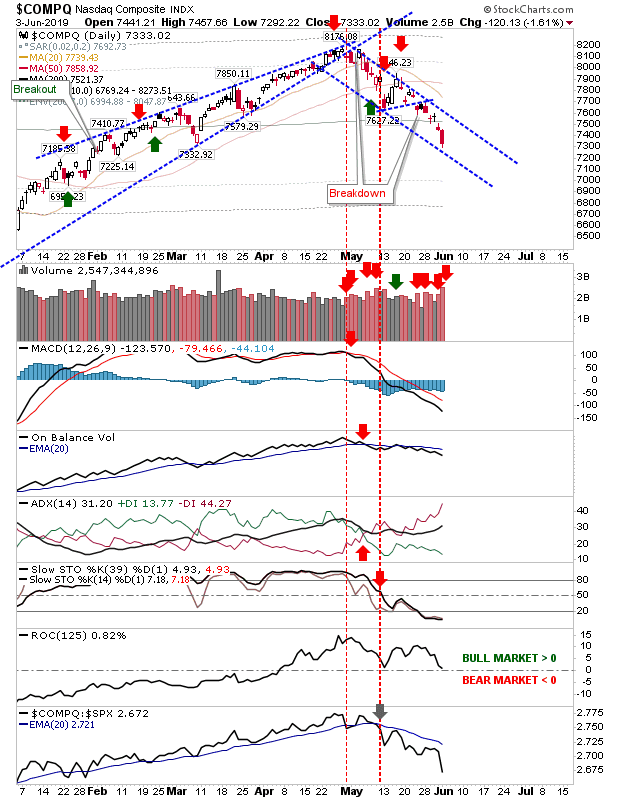
Rumors of antitrust probes for Facebook and Google put a weak market under further pressure. The Nasdaq took the brunt of the selling on confirmed distribution. In the case of the Nasdaq I have redrawn the downward channel line which will place today's lows at support of this channel line.

Declines Continue

Image
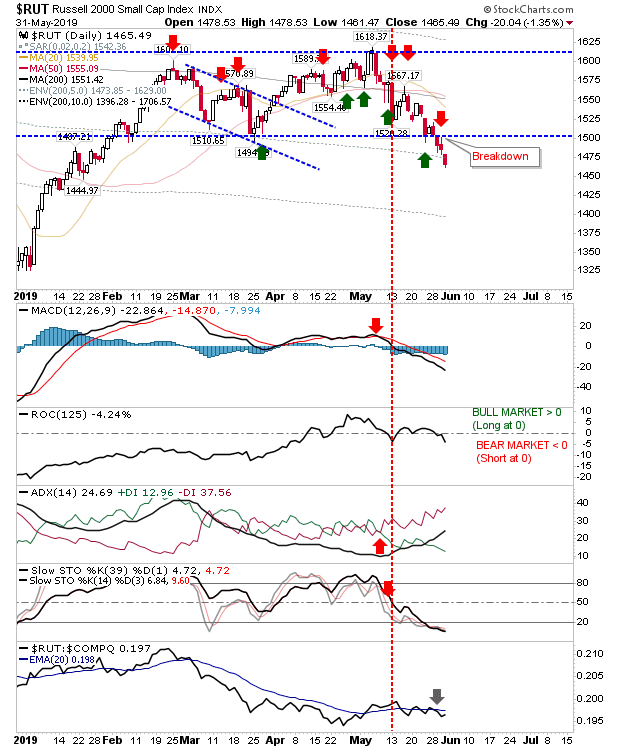
It was yet another day bears maintained control of markets with the Russell 2000 again leading markets lower. The Russell 2000 is looking at swing low support of January 2019 after breaking below horizontal support. Converged moving averages (20-day, 50-day and 200-day MA) are now major resistance but markets would be a a month or two away from this test even if there was a rally now.

Archive

Show more