Posts

Showing posts from November, 2022

Sellers attack resistance in the Dow Industrials
Image
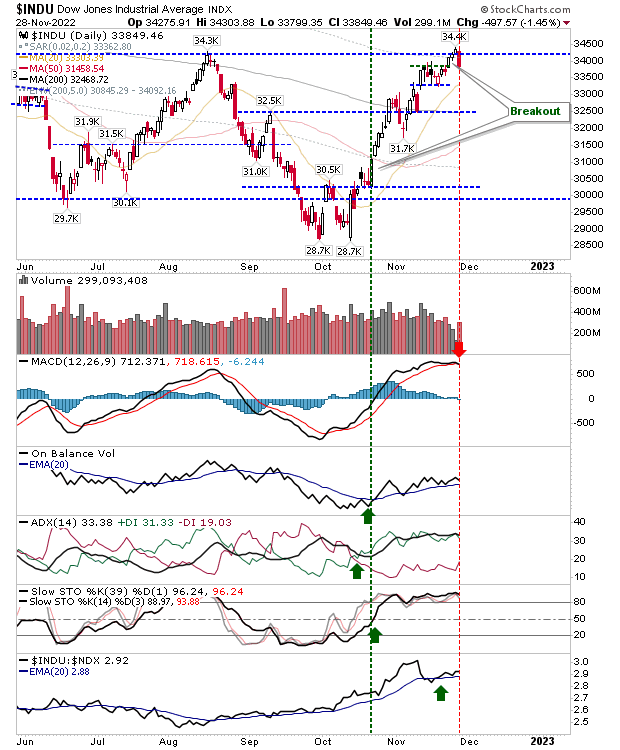
Traders booted the juniors off the trading desks following the holidays and they weren't happy.  Selling in the Dow Industrial Average came off the challenge of resistance defined from the last swing high.  The only technical change was the MACD trigger 'sell' but relative strength remained in the Dow's favor.  Look for a move back to the 20-day MA. 

A "comfort blanket" of buying; Large Caps attract more interest.

Image
Today was the kind of day which doesn't show up in many scans, but it was one where bulls hold the advantage. Bullish accumulation further confirmed the positive nature of today's action. Any gain tomorrow would be enough to clear what for many indices, is a 'bull flag'.  The Nasdaq finished with a bullish engulfing pattern on higher volume accumulation which also saw a 'buy' trigger in On-Balance-Volume. Techncals are net bullish with the index sitting just above its 50-day MA. 

A quiet close to Friday's trading but Dow Jones ready to breakout

Image
Markets eased back from their weekly highs on declining volume, but has been a fairly orderly move lower.  Support levels are there for indices to lean on.  The Nasdaq has its 50-day MA alongside its 20-day MA to use as support.  The 'black candlestick' is typically a bearish one-day candle, but as it's not positioned as a swing high it carries less weight.  Technicals are net positive, although there is a return to underperformance against the S&P. An ideal candlestick would be a gravestone 'doji' or a bullish hammer as an end point to this decline. 

Opening gaps lower fail to trigger sell-off

Image
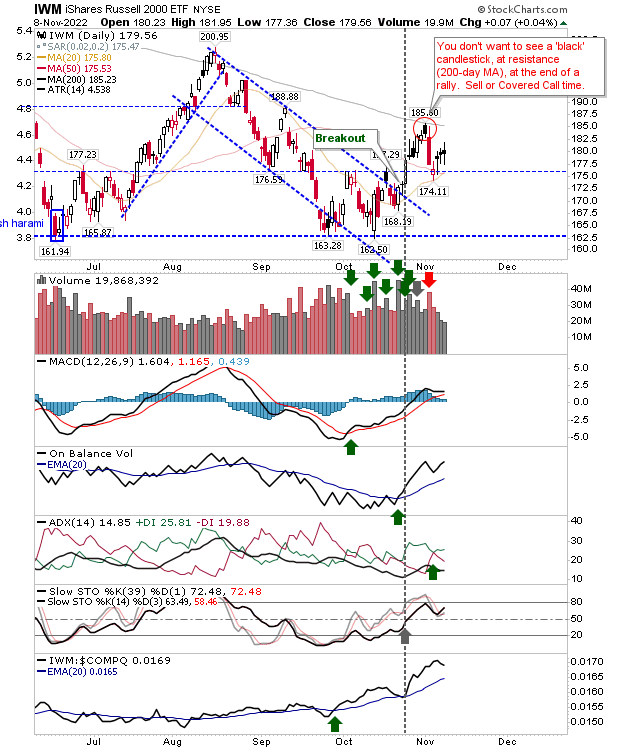
With markets extended from their rallies off October lows it would be natural to expect some protacted level of selling to occur after weeks of gains.  A similar-so attempt after the last swing high failed, and now the most recent pivot from the Novemebr swing high looks destined to fail too.  In the case of the Russell 2000 ($IWM), today's gap down undercut its 200-day MA, but did enough to hold on to 50-day MA support.  Technicals are net bullish, although the index is underperforming the Nasdaq.  Also on the positive front, is the drop in volume on sell-off days.  While I noted the bearish inverse hammer last week, if there is a close above this high it then this pattern will be negated.

A day of Indecision for the Indices

Image
Today was a day where either the glass was half-full or half-empty - depending on your point of view.  Starting with the Nasdaq, a potential bearish 'harami cross' - usually the most reliable of reversal signals - was negated by a bearish 'black' candlestick; so while one bearish marker was negated, it was negated with another bearish candlestick.   Supporting technicals are bullish, and relative performance to the S&P has generated a new 'buy' trigger.   So, despite the bearish day-to-day action, the longer term picture is turning more bullish.  And, the price breakout is still holding. I would be looking for some selling tomorrow, but if the breakout can hold it will be good news for the broader indices.

Friday maintains bullish momentum; breakout in Nasdaq.

Image
Friday's star was the Nasdaq as it managed to break past resistance marked by swing highs in September and October. There wasn't any accumulation volume to go with the breakout, but there was a 'buy' trigger in On-Balance-Volume - in fact, all supporting technicals are net bullish. And, relative performance of the index to the S&P is near a new 'buy' trigger. For next week, we will want to see the 11,250 zone hold as support - intraday violations are okay, end-of-day breaks are not. 

Markets rally on CPI data, but remain range bound

Image
Today's gains reversed what was looking like a new leg lower, and the degree of today's advance was no doubt supported by short covering coming off yesterday's preferred strategy.  I wouldn't read too much into the CPI data - news is used to fit the narrative - and many of the indices are still locked inside trading ranges which could go either way.  The S&P managed to make its way past the most recent swing high as it looks to push towards its 200-day MA. Technicals are improving, although On-Balance-Volume retains its 'sell' signal. If this buying is real, the S&P should be the index to benefit.

Markets struggle in advance; neutral doji / spinning tops abound

Image
Markets gain, but they are hardly convinving.  The Russell 2000 ($IWM) is the best example as it posts its fourth day of doji/spinning top candlesticks - which post a net gain - but do so from a point of indecision. Technicals for the Russell 2000 are still net positive, but I'm expecting a big red candlestick anytime soon. Note the falling buying volume, another reason to lack confidence in the current advance. 

Awkward Friday for indices - but looking for weaker finish by end-of-week

Image
Indices had a confusing day of trading on Friday.  In traditional candlestick terms the S&P, Nasdaq and Russell 2000 ($IWM) all finished with either bullish 'dragonfly' doji or bullish hammer.  The problem is that all of these candlestick appeared off a gap higher from the open instead of a gap lower.  The net effect of this is that we are effectively left with a more neutral finish to the week than could have otherwise have been the case. While the Nasdaq's finish fits with a bullish 'hammer' it also (sort of) engulfed Thursday's trading with its spike low.  Technicals remain net bearish and relative performance to the S&P is in the dog house.  The one positive is the continued defence of former channel resistance - turned support. 

An October low retest is in effect, and the Russell 2000 still holds the best hand.

Image
In the end, it was 200-day MA resistance for the Russell 2000, and the October swing high of 11,200 in the Nasdaq, which proved to be the step-too-far for the rally in the indices. In all cases, indices are now moving back to the point rallies started in October.  In the case of the S&P, the rally managed to close above the 50-day MA before sellers kicked it back from whence it came.  Currently, it's leaning on the 20-day MA with a non-too convincing - neutral - 'spinning top' candlestick.  Momentum is a long way from oversold (and stochastics [39,1] turned from the midline - a typical reversal in a bear market), so it's hard to see today's trading at a point where you can be a buyer. 

Archive

Show more