Posts

Showing posts from March, 2010

Stock Market Commentary: MACD 'Sell' For S&P
Image
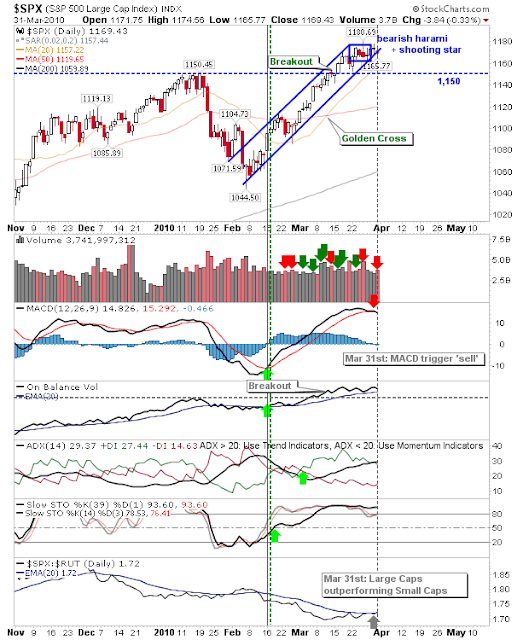
Following the weakness which has emerged in Tech and Small Caps, the S&P followed suit with a MACD trigger 'sell'. The index closed with a neutral spinning top which held on to channel support. The Nasdaq is approaching rising support too; Wednesday's mini-Shooting Star played on by confirmed distribution With the Nasdaq 100 joining the 'sell' side Looking for more of the same Thursday. Stock Breakouts Eighteen stocks qualified for my scan but looking through the charts didn't return much: ATSG gained 44% to gap through 20-day, 50-day and 200-day MAs but would need to stabilise above $2.80 to have merit, closed the day at $3.35. IMMR gapped and closed bang-on psychological $5.00 support. The MACD regained the bullish zero line after a 'buy' trigger. The much maligned OSTK surged off 200-day MA support but couldn't maintain all of its gains by the close; $15.00 support is the key area to watch, it closed the day at $16.23.

Stock Market Commentary: More Indecision

Image
It was a lackluster day for the markets with the S&P closing unchanged on the day. The Nasdaq 100 continued its run of doji; note the two bearish distribution days stuck amongst the low volume buying. The semiconductor was a little more proactive and mounted a defense at support. If Tuesday's gain can follow through it will help the Nasdaq and Nasdaq 100 Market Sentiment as measured by the Bullish Percents are showing some contradictions; new highs as part of a breakout in the indicator, but the CCI is on a 'sell' and there is a bearish shift relative to the Percentage of Nasdaq stocks above the 50-day MA. Can action in the semiconductors convert to a positive Wednesday for the Nasdaq and Nasdaq 100? Stock Breakouts There were 24 breakouts in total; four were of interest but six were low-grade penny stocks. Not much cream left to skim? Follow Me on Twitter Build a Trading Strategy in Zignals; Read how and earn real money (once out of Beta) in th

Stock Market Commentary: Mixed Bag

Image
Some indices closed higher, others closed flat. Volume was lower all around. Large caps did 'the best' but the bearish pressure from the combo harami and shooting star remains. Tech was more neutral; the Nasdaq and Nasdaq 100 finished on indecisive doji with the semiconductor index lingering around support. For the semiconductor index there was a whipsaw 'sell' trigger and a drop out of overbought levels for stochastics - generally signifying a weakening of trend. But while support holds bulls keep control; note 20-day MA is rising to meet price. Note the Nasdaq also had a MACD trigger 'sell' Small Caps were quiet but its technicals are growing increasingly bearish. Of sentiment indicators the Nasdaq Summation Index completed a bearish cross of 5-day and 3-day EMAs in addition to a MACD trigger 'sell' and a 'sell' relative to Bullish Percents - rally cracking Is there enough for bears to turn the screw? Momentum is with the bulls s

Weekly Review of Stockcharts.com Publishers' Charts

Image
Friday's shakey end to the week still left markets trading above a slew of support levels. Will anything change this week? Anthony Caldaro of Objectiveelliottwave has revised the prior wave count for the ABC correction off March 2009 lows; will wave 1 = wave 5? If so, there is more upside to come Is there a five-wave phase within a five? Does this suggest a significant move higher for Large Caps (higher than Tech for example)??? Yong Pan of Cobrasmarketview continues with a decidely neutral take on the market; this has changed little in weeks - good news then? Other than tracking negative divergences there is little new here: Is the top in place? Richard Lehman of Trendchannelmagic.com offers his views: 3/26 -- A few more tests of blue minis and a few more tests of green channel support lines puts the rally in a little more precarious position as the last couple of days for quarter-end window dressing approach. Watch closely for possible breaks early nex

Weekly Market Commentary: Nasdaq 100 Makes It First To 2008 Reaction High

Image
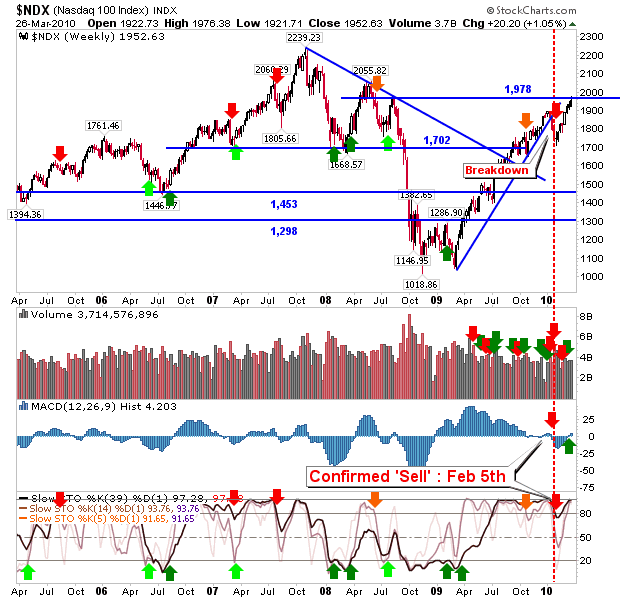
While Small Caps lead on the daily timeframe, it's the Nasdaq 100 which is leading the weekly charts. Friday saw the lower of the two 2008 reaction highs hit by the Nasdaq 100; will this be the reversal point? The S&P is not there yet but with the MACD trigger 'buy' bulls got another tick in their column. Breadth indicators also switched bullish. The Bullish Percents offered what could be a bull trap 'Buy' March 15th, but because the indicator is so overbought it may not bring as quick a reversal (but it could be sharp) as it did back in 2007. Buyer beware! Of the stock breakouts there was a grand total of 18 but only Signet Jewelers looked worthy of attention: Follow Me on Twitter Build a Trading Strategy in Zignals; Read how and earn real money (once out of Beta) in this PDF. Dr. Declan Fallon, Senior Market Technician for Zignals.com , offers a range of stock trading strategies for global markets under the user id: ‘Fallond’, ‘ETFTrader’

Stock Market Commentary: They Came - They Saw - They Left

Image
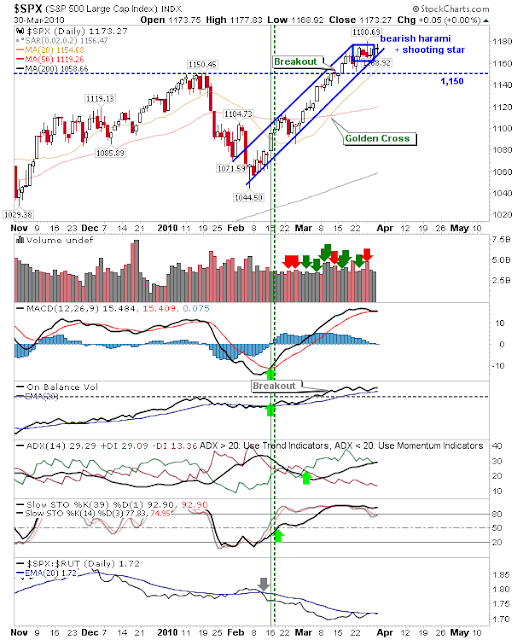
Bulls had looked to had got the jump on bears with very strong early gains, but it was just too much to maintain and the usual debt concerns came back to haunt the markets. Thursday's shooting star for the S&P added to yesterday's bearish harami with a good dose of distribution volume; Friday could be an ugly day for the index. The bearish shooting star made its presence felt for the Nasdaq, also with confirmed distribution. Rising support is a little further away and the upcoming MACD 'sell' will likely see the start of a short term decline (more than just a couple days worth of weakness).  Small Caps have already triggered a 'sell' in their MACD.Note underperformance to Tech averages - a bearish development as speculative small caps lose their leadership role. The Percentage of Nasdaq Stocks Above the 50-day MA also triggered a 'sell' in its MACD in addition to its test of the bearish divergence. Another tick in the bear column. Friday

Stock Market Commentary: Semiconductors Break in Trouble?

Image
A late posting on this, but yesterday's downward action was not surprising given a mix of profit taking and fresh short positions prevented any further push higher. The semiconductor index took to the brunt of the selling and its new-high breakout is under threat with its close at the low end of a thick paint-brush-support level. In all likelihood the index will drop back to former triangle resistance-turned support. For other indices there were no real surprises. The S&P traded an inside day, potentially produing a bearish harami with selling volume trumping the prior day's buying. A move back to test support of what is a very narrow and acute angled channel would appear to be the setup for Thursday - although if the rally is to succeed in the long term it will need a channel less steep than the current one. The breakout stock - well ETF - for today is $EUO; given the turmoil in the Euro it's perhaps a better play than some of the stock picks in this extended mar

Stock Market Commentary: Further Gains on Light Volume

Image
Bulls caught last Friday's shorts out, forcing them to cover their positions. The buying/covering occurred right into the close. Volume was tepid, although greater than yesterday's for the S&P. The buying didn't escape either Tech Or Small Caps (although technicals haven't recovered enough to suggest this is not part of a topping process) The real winner was the semiconductor index. It managed to close at a new high for 2010 - following the lead of the Nasdaq and Nasdaq 100. If tomorrow gaps higher watch the first hour of trading for a gap close; an early sell off which closes the gap and pushes lower is likely to spend the rest of the day in selloff mode. This market is toppy but it would be a brave short to jump in front of the train.   Follow Me on Twitter Build a Trading Strategy in Zignals; Read how and earn real money (once out of Beta) in this PDF. Dr. Declan Fallon, Senior Market Technician for Zignals.com , offers a range of stock trading

Stock Market Commentary: Recovery Without The Volume

Image
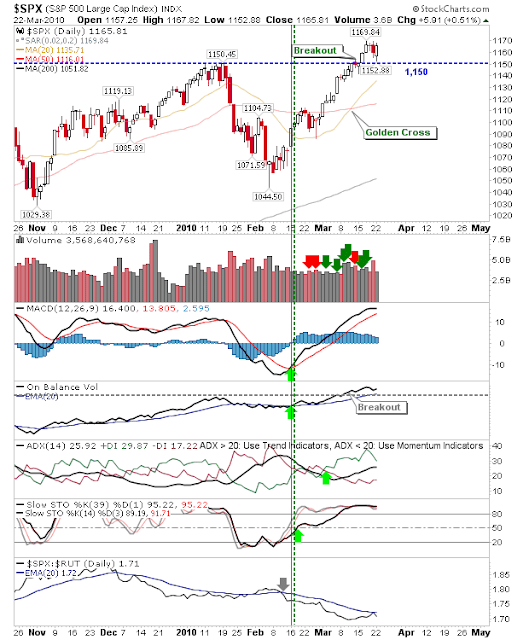
After Friday's trading, markets had posted the first significant loss on volume - enough to suggest it was the beginning of the end for the various market rallies. However, bulls proved they weren't done yet as they pulled up the boot straps from a weak open. This was no more clearly evident in the S&P which enjoyed a picture perfect defense of breakout support. The Nasdaq closed with a surprising bullish engulfing pattern, a pattern which works best off oversold conditions, not the heated market currently experienced. The semiconductor index posted a 2.5% gain which helped boost the Tech averages. Technicals are a little scrappy with the CCI oscillating around the '100' sell trigger line and the Directional Index running side-by-side in a net trendless fashion. Small Caps are the tricky one. On the face of it they also enjoyed a strong day, but supporting technicals are little rockier with the MACD trigger line on the verge of a 'sell' and the CCI

Archive

Show more