Posts

Showing posts from January, 2009

Weekend Review: Neutral once more

Image
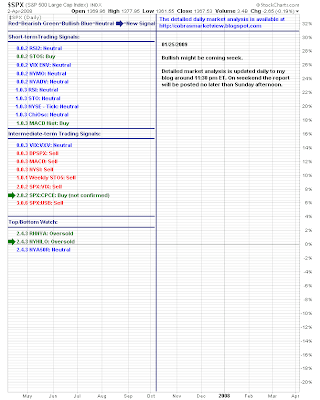
Early attempts at a buy signal for the Nasdaq and S&P drifted as stochastics again dropped into oversold territory. Their respective MACD's maintain a 'buy' but for all intent and purposes it looks like both indices want to check out November lows. Nasdaq Bullish Percents also kissed good-bye to its breakout, leaving instead a bull trap and a sell trigger in stochastics; best bet for bulls is a new higher low which shouldn't be too difficult, particularly if it is associated with a new low in the Nasdaq. The Nasdaq Summation Index could not have played better resistance; when it breaks it will have great significance and likely confirm the next cyclical bull market. The NYSE Summation Index has fallen into line with the Nasdaq. It too has a clear definition of resistance The sensible thing to do is to wait for breadth indicators to enter more oversold conditions before considering long side positions. Dr. Declan Fallon, Senior Market Technician, Zignals.com the fr...

Volatility Double Bottom

Image
Volatility is primed to rise. A potential double bottom could be shaping up, with a push to the neckline at 56.89 a distinct possibility. In the short term we could see a move to the 50-day MA as the S&P works on a November low test. If November lows hold in the S&P then I would expect the VIX to retreat to and then below its 200-day MA; creating a seasonal rally which could last into May. If S&P November lows were to break as support then I would see no difficulty in the VIX cracking through 56.89 and set up another sharp loss scenario for the S&P, with the VIX pushing 80 yet again. My hunch says November lows will hold for the S&P but I can see the potential for disaster if they didn't. Dr. Declan Fallon, Senior Market Technician, Zignals.com the free stock alerts, market alerts and stock charts website

Stock Market Commentary: Yesterday's gains undone

Image
All the work done in pushing the Nasdaq and Russell 2000 above their respective 20-day and 50-day MAs was undone by Thursday's selling. Only the Nasdaq 100 closed above its 20-day MA as its losses relative to the other indices was less The SOX made a picture perfect reversal off resistance Volume was lighter than Wednesday but this will be cold comfort for bulls. The SOX has 50-day MA to lean on tomorrow - as does the Nasdaq 100. But large caps don't have that luxury. For them November lows look to be the target. Dr. Declan Fallon, Senior Market Technician, Zignals.com the free stock alerts, market alerts and stock charts website

Stock Market Commentary: Mixed bag

Image
Solid gains helped some indices more than others. Troubling moving averages were cleared for the Nasdaq, Nasdaq 100 and Russell 2000; but for the Nasdaq 100 this meant running into larger declining resistance dating back to last September. The semiconductor index encountered similar resistance and tomorrow will be a big day for the it; a break could set up a run to the 200-day MA Breadth indicators for the Nasdaq are all bullish (once more); perhaps there is more to the 'Santa Rally'? Best of all, the Percentage of Nasdaq Stocks Above the 200-day MA made sharp gains, suggesting more stocks are turning long term bullish. Dr. Declan Fallon, Senior Market Technician, Zignals.com the free stock alerts, market alerts and stock charts website

Stock Market Commentary: Struggling to break through moving averages

Image
Another day for the indices to squeeze small gains without cracking through moving average resistance. The lack of follow through to the paltry gains is concerning, the next day of selling could see all three days of gains wiped out in one. The Percentage of Stocks above the 50-day MA is attempting a bounce but technicals don't suggest much confidence. The Dow provides the best opportunity for a swing trade with a break and counter stop on Tuesday's action. Technicals point to weakness so the anticipated move would be down. Disappointing is the best you could say as a bull. Dr. Declan Fallon, Senior Market Technician, Zignals.com the free stock alerts, market alerts and stock charts website

Nasdaq needs to crack 50-day MA; Russell 2000 toying with former broadening wedge resistance - new support

Image
With large caps underperforming it is up to tech and small caps to lead the market higher. Money flow has been relatively good for the Nasdaq but yesterday's 'ping' off the 50-day MA shows there is much work to do. Drawing a new up channel for the index leaves a tight squeeze against a possible breakdown, or potentially some fresh air up to 1,700. A downward break sets a target of 1,300, but as Richard Lehman said yesterday, support/resistance tests rarely play to market expectations; prospective buyers may decide to step in around 1,350 or wait for 1,250 before joining the fray. But a break of the 50-day MA will give bulls reason for optimism. Double bottom watchers (November retest) should keep an eye on the Transports. Yesterday's doji keeps the buyer-seller battle in the balance, but the tight trading will result in a substantial 1-day move depending on which 4-day high/low breaks. What goes for the Nasdaq goes for the Russell 2000 too. The Russell 2000 is likely to...

Stock Market Commentary: Moving Average Resistance

Image
Early attempts to follow through from Friday soon faded in weak afternoon trading. The 50-day MA played as resistance in the Nasdaq and Nasdaq 100 Small caps encountered similar resistance, but large caps were left in limbo with reaction lows in October acting as temporary support. The pennant consolidation pattern in the Dow narrowed but has yet to break; Tuesday could see a very strong reaction. Swing trade with a stop on the reverse Volume was lighter, so no real consensus as to what direction market participants want to move the market over the longer term; again, the tight trading typically produces strong reaction moves and this might give the market direction over the next six months. Dr. Declan Fallon, Senior Market Technician, Zignals.com the free stock alerts, market alerts and stock charts website

Weekly Stock Charts review from Stockcharts.com Publishers

Image
(Running late; did half of this before Monday's open so some of the comments are already dated) Bulls are trying, but the November lows appear to be sucking the life out of them. What had the Stockcharters to say about it. Yong Pang lists a neutral to nascent bull environment in the short term, within the context of a bearish intermediate time frame. Looking at this chart I would think things would get worse over the next couple of days before rallying back to January highs... But I see on the SPY chart how a short term bullish scenario could play out: Although breadth indicators remain bearish 30-min chart SPY also looking weak: Maurice Walker is on the soap box this week. I agree with some of what he says in principal, but in practice what he states can never happen thanks to greed and corruption. Unfortunately it's a case of damned if you do and damned if you don't; greed and corruption exists on both sides of the fence and given recent events I'd take government p...

Weekend Review: Testing November Lows

Image
The attempted bounce in the S&P stumbled as stochastics fell back into oversold territory as the index feels for support at November lows. This same story repeats for the other indices. Only the Russell 2000 shows evidence of strength, it's bullish 'buy' triggers holding in the face of recent selling, but for how long? Sentiment indicators also struggled; the nascent breakout in the Bullish Percents dropped back into its prior consolidation, but are well off their lows (not a good thing) Same for the S&P Bullish Percents (and it crept in with a 'sell' in stochastics): Stochastics for the Nasdaq Percentage of Stocks above the 50-day MA switched to a 'sell' signal adding further bearish pressure to the Nasdaq Summation Index completed its reversal off resistance: Dangerous times for markets; sentiment suggests the 'Santa Rally' was nothing more than a 'bull trap' and considerable losses could follow. Price action suggests a test of Nov...

Stock Market Commentary: Higher Volume but little else

Image
Not surprisingly, on a day which followed a big up day (which followed a big down day), the markets were effectively unchanged. Volume did rise, so bulls and bears were busy doing battle (MSFT vs AAPL too). The higher volume registered as a distribution day but given the markets traded inside yesterday I wouldn't consider it a major shift to bears - although bears held the advantage going into today based on the indices relative position to their moving averages. The only technical note was a lost of mid-line support in stochastics for the tech averages and small caps, enough so to turn the SOX and Russell 2000 net bearish. Dr. Declan Fallon, Senior Market Technician, Zignals.com the free stock alerts, market alerts and stock charts website

Dow Transports test November lows

Image
Interesting times for the Dow Jones Transportation Index (and for lovers of Dow Theory). One can only assume the Dow itself is heading for a similar test, but so far bulls have defended November lows in the DJTA. The good news for bulls were the two higher volume accumulation days on tests of support. Combined with a sequence of bullish candlesticks on oversold stochastics. The concern is the increase in bearish trend strength after a period of cooling in the latter part of 2008. Although the index appears to be attempting a double bottom, confirmation of this won't come until 3,728 is breached. Additional resistance at 4,058 (the former head-and-shoulder neckline) and the 200-day MA will keep the lid on any secular change from the bear trend. But initial suggestions favour a short term play to double bottom resistance with a stop on a break of November lows. Dr. Declan Fallon, Senior Market Technician, Zignals.com the free stock alerts, market alerts and stock charts website

Stock Market Commentary: Bulls try again

Image
With President Obama safely in place in the Whitehouse attention turned back to the markets. Bulls made a second run at buying, undoing most of yesterday's damage and in the case of the Nasdaq, did so on higher volume accumulation. 20-day and 50-day Moving Averages remain key resistance and this pressure will increase as markets pull themselves away from oversold conditions. Small caps really need to show leadership if confidence is to be restored. The 20-day MA is more important than the 50-day MA in this regard and a new reaction high past 519 would set up a sequence of higher highs and higher lows. How big and ask is it? Technicals are mixed, but are siding with bears - so today's strength was not one to buy. The other area to watch is the semiconductors. The SOX is clinging to its 50-day MA and unlike other indices did not violate reaction lows yesterday. However, it is underperforming against the Nasdaq 100 and this needs to improve if it is to influence the Nasdaq and Nas...

Powerpoint on Technical Analysis: What is it? How can it be used?

Just the slides for a presentation given at TCD department of Business Studies. Available online for the benefit of students who had a tough time following a speed talking Irishman! Uploaded on authorSTREAM by fallond The new dark theme charting is coming soon, but the functionality presented here is complete and available from Zignals . Dr. Declan Fallon, Senior Market Technician, Zignals.com the free stock alerts, market alerts, and stock charts website

Summation Indices suggest markets have a long way to fall

Image
Just as occurred last September and May, the Summation Indices are in the early stages of a rollover top. While the rollover top does not represent an automatic meltdown in the parent indices (as indices can find support on the way down like they did in March 2008), it can give an indication as to what may happen. In the May-Jul 2008 correction the indices gave up 15%-16.6% from peak to trough in the Summation Indices. The problem with this scenario is the indices are already down 13.5%-14.7% from their "Santa Rally" peaks and the Summation Indices are only starting to rollover. If we were to endure a repeat of September, then we could see the indices down 39%-48% bringing the Nasdaq down to 949 and the S&P to 537 (if you split the difference in the projected range). This would bring the S&P and Nasdaq back to 1995 historical levels and the time the "New Economy" bubble kicked off in earnest. Whatever happens, the Summation Indices (as are other breadth indi...

Stock Market Commentary: Down Big But No Volume

Image
It looks like attention was diverted elsewhere as markets headed south on another round of financial weakness. The only positive was the lackluster volume - again, other distractions no doubt playing a role here too. The 50-day MAs proved to be a step too far for the 2-day rally and a November retest remains the favoured option. Technically, the Dow shifted net bearish as key 8,164 support gave way: The S&P was close to doing likewise, only on-balance-volume kept it from turning net bearish: I am expecting some follow through downside tomorrow which may even see the November low retest come into play. Dr. Declan Fallon, Senior Market Technician, Zignals.com the free stock alerts, market alerts and stock charts website

Weekly Stock Charts review from Stockcharts.com Publishers

Image
A busy week for the markets; have bulls done enough to avert a November low retest? Yong Pan's weekly summary is not looking too green (green of a different kind really): The S&P bottom watch is not looking very bottom worthy: The break from the rising wedge looks more significant (and dominant): I always get concerned when a bullish hammer fails to confirm; the candlestick for January has all the makings of a November low retest; bulls will hope for a close back at the 900 level by month's end to create a neutral doji, or up in the 950 range for a bullish hammer. Pan also notices the first distribution day in a while and the prognosis isn't good: Maurice heads with the cheery: The Financials Derail The Rally Sliver of hope? But let me be clear the bottom failure swings on the weekly charts are still supporting the November lows and the rally off those levels. If we do form additional right shoulders over the next three weeks or so with out doing further technical dam...

Archive

Show more