Posts

Forrester Research (FORR)

Image
Forrester Research Inc. ( FORR ) featured in my newsletter [ $ ] as a stock testing triangle support at the 200-day MA. A couple of days after it's initial feature the stock created a bullish hammer at triangle support. What followed was a steady rise to resistance, with the breakout completing earlier this week on the back of earnings . Yesterday followed with a successful backtest of $28.35 support. The point-n-figure chart fell a penny shy of a triple top breakout, with a current upside target of $43. Get the Fallond Newsletter Trade my Stock Picks at

Dow and Nasdaq 100 are indices to watch

Image
The Fed reversal started late in the day, although futures suggest a higher open. The Dow flashed a (bearish) gravestone doji on higher volume, with the 200-day MA lurking overhead to act as resistance. A push back to the 50-day MA looks the most favored response to relieve overbought conditions, but any close higher today would make a strong case for a 200-day MA breakout. Why? The current set-up looks picture perfect from a bear's perspective, so if it didn't play to expectation you would have to be worried (from the bear side). The Nasdaq 100 has inched its way to the 200-day MA. The gap created at 1,850 looks a logical downside target, but it wouldn't take much buying to push it above its 200-day MA. Get the Fallond Newsletter

F-day

Image
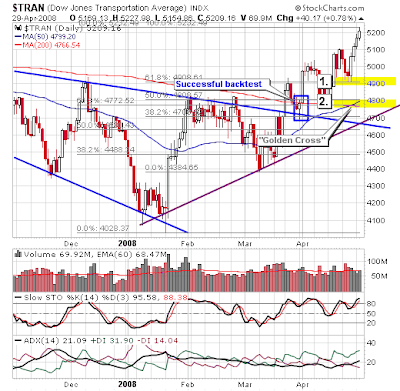
How will the market react to whatever the Fed decides to do? Because of the tight trading for the past few days the expectation will be for a sizable move one way or the other. The 200-day MAs are a logical upside target, with the 20-day and 50-day MAs lurking below. Markets have effectively traded sideways since the January bottom and it would be good for this pattern to be put to rest. The best action for the bulls comes from the Transport index (even with all the woes in the airlines). The ADX confirms a bull trend and the "Golden Cross" between the 200-day and 50-day MAs shows a long-term bullish shift. Given this, I suspect we will see higher prices over the coming weeks even if the Fed 'disappoints'. Points [1] and [2] on the chart mark likely retracement points (based on Fibonacci and support) for a negative reaction to the Fed. Get the Fallond Newsletter

Link reading

Not expecting too much for today, so took a look at what's going on my feed reader: CXO Advisory takes a look at AlphaKing: In summary, testing indicates that the AlphaKing Trading Indicator may have some value for timing the Nasdaq Composite index, but the duration of the live data sample is much too short for reliable inference. Financial Week looks at blogmining. Econoblogging as a step towards a job. Vix and More on High Implied Volatility . Wall St. Warrior always has a great pre-market warm up. Not expecting much today Herb Greenberg's five lesson's learnt. (Via Maoxian via TraderMike) Why things cost $19.95 (Via Maoxian) How to monitor websites that don't have RSS feeds - handy (Via Maoxian) Bill Rempel's Seven Quantifiable Ways to Define Trend . The Average Directional Index is my favorite. Get the Fallond Newsletter

Stockcharts.com weekly review

Image
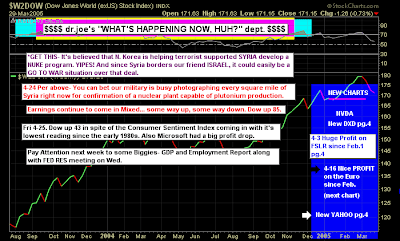
A week which has mostly passed me by with respect to the market. So what did happen? Dr. Joe is looking to nest week's figures: Dollar looks ready to make some headway north, possibly to 77-78 level: He has given the new Stockchart's charting features a go: But there looks to be a breakout in the Dow (Joe doubts it another chart - but it looks good to me). PPO looking strong: Maurice Walker is now second ranked Stockchart public list; his weekly review makes it one of the best. I like his analogy for this week: I've been following the a recent news story about John Darwin, who was a canoeist that faked his own death. He and his wife committed insurance fraud as he went into hiding in Panama. Darwin claims he had amnesia for the past five years. If he is found guilty he could face up to 10-years in prison. Darwin had been written off as dead by everyone, only to come to find that he wasn't dead after all, he was only on a short hiatus. John Darwin was alive, and so is

200-day MAs fast approaching.

Image
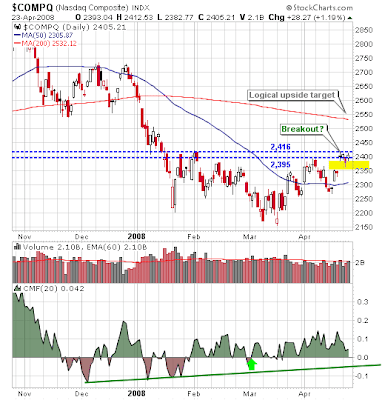
Bulls will have to be pleased with the last few days of action. Volume has definitely sided with them and breakout gaps for the Nasdaq and Nasdaq 100 look to be holding. The next likely stumbling block for the averages looks to be the 200-day MAs. Any weakness should relieve overbought conditions, but not enough to close those key breakout gaps. Get the Fallond Newsletter

Top-10 (9!) stock blogs

Thank you to Fiona King at CurrencyTrading.net for listing me as part of their top-9 stock blogs. Also thank you to all who have sent their respects by email. I very much appreciate the support.

Archive

Show more