Posts

Showing posts from December, 2021

Indices Shift To Trading Ranges
Image
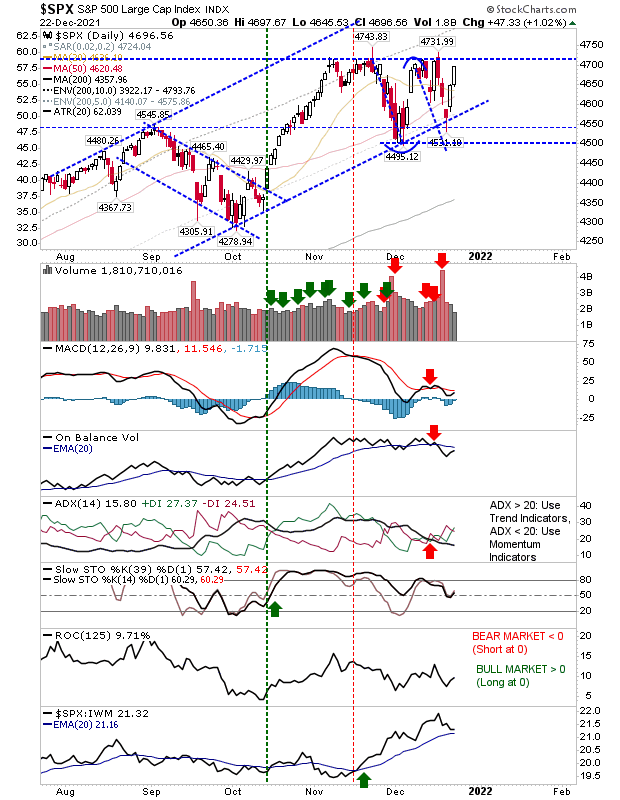
The past few days has seen indices rally back to resistance, or at least reaffirmed support. Given the action, it's looking increasingly likely this status quo will continue through to the end of the year and it will be the New Year before there is a decisive move one way or the other. For the S&P, this measn we have a trading range defined by the highs of November and the swing lows of December.  Another tag of resistance would likely mean a breakout will follow as triple tops are rare and it seems unlikely we would see one here.

Nasdaq Breaks Support as Russell 2000 Defends

Image
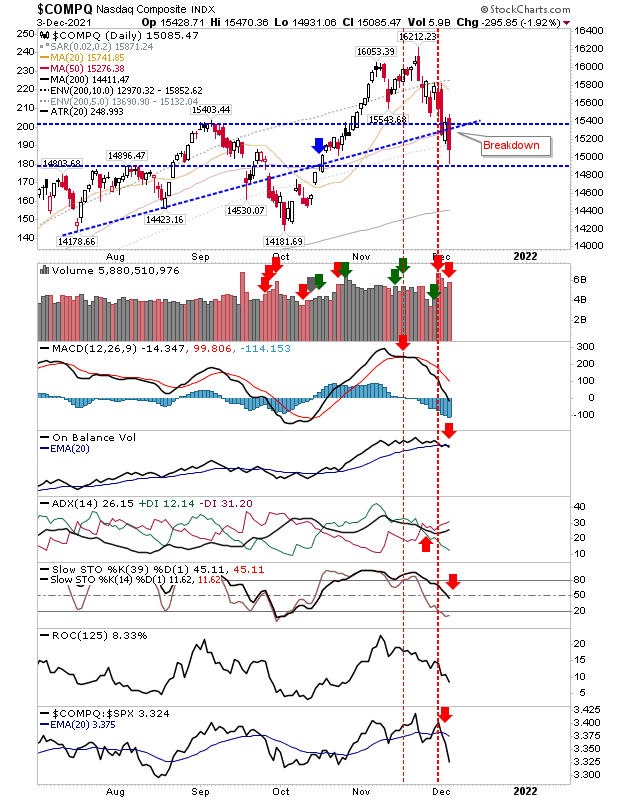
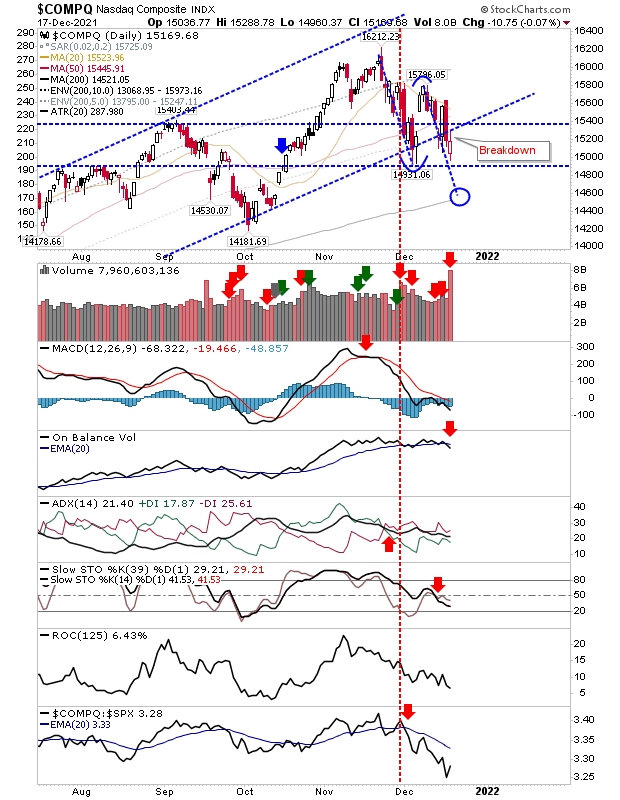
The Nasdaq broke channel support but managed to finish Friday above its open price in what could also be considered a support test.  The measured move to the 200-day MA remains in play for the index, but until there is a loss of 14,900 the possibility of a double bottom is also an option. The candlestick finish on Friday wasn't that bullish, so edging in favor of the measured move lower. 

What goes up...

Image
While I didn't post yesterday I had thought yesterday's gains held promise with volume rising in confirmed accumulation.  However, today's sharp reversal put paid to those gains. It's not a total disaster, as December swing lows remain intact for the Nasdaq, S&P and Russell 2000 - but the probability of these lows breaking is now significantly higher. In the case of the Russell 2000 we had a "bearish engufling pattern", but note, this pattern only carries weight as a reversal in an overbought market and we don't have this scenario here (stochastics/momentum is oversold).  It does look like the measured move target down is still in play.  Once the December swing low is taken out I would be looking for selling to accelerate.

Russell 2000 approaches December low

Image
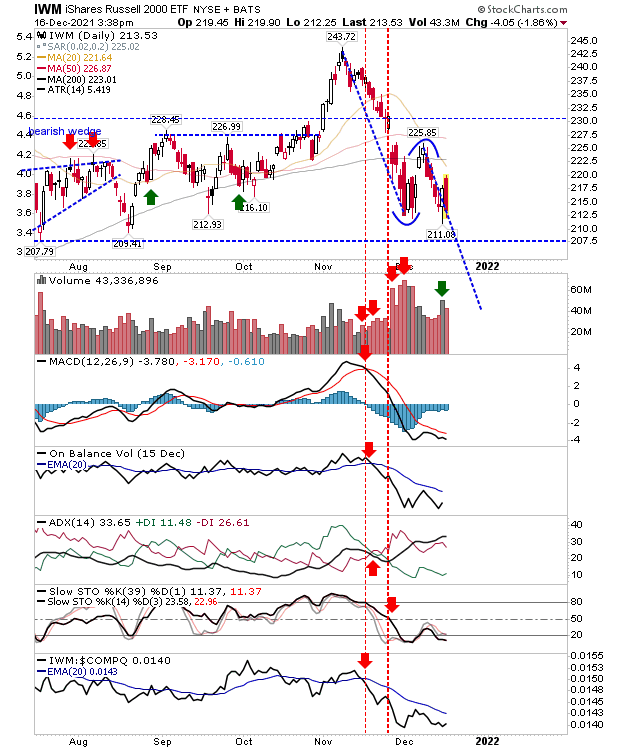
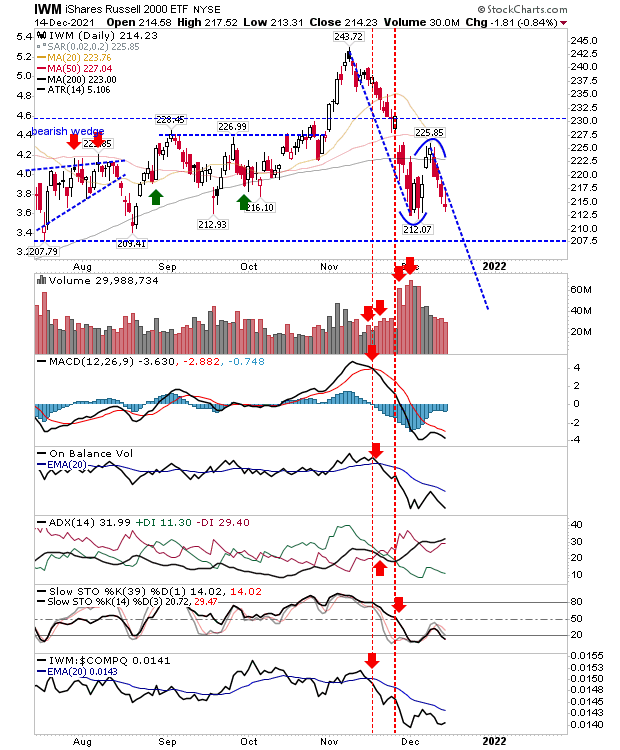
If we are going to see buyers step in to defend the December swing low for the Russell 2000, then they will need to start buying now. Today delivered the fourth day of selling in a row and only the drop in selling volume offers a suggestion the desire to sell may be on the wane.  Technicals for the index remain net negative and relative performance hasn't improved much since the December low was defined.  A continuation of the measured move lower remains the preferred outcome here. 

Russell 2000 continues to rollover

Image
It was a mixed bag for indices with the Russell 2000 continuing its move towards the December swing low while Large Caps edged higher.  The Nasdaq had a middling Friday, ending the day on a neutral doji despite a higher close.  In the case of the Russell 2000 the index made a small loss but also finished on a neutral "spinning top" - comparable to the action in the Nasdaq. Technicals are net negative although stochatics moved out of oversold conditions. 

Russell 2000 ($IWM) target of $195

Image
It's looking more likely that we will see measured moves lower across lead indices.  The Russell 2000 is the most vulnerable, and has the the deepest measured move target of $195 from the ETF ($IWM). It should be noted, should the Russell 2000 reach this target it would only fall back to where the index traded this time last year, and well above breakout support of $165. The Covid low of 2020 was clearly a good buy (as noted in the tables you see below this article), the next low (if it reached is measured move target) will be another.

Dead Cat Bounce?

Image
Markets made an attempt to bounce after a few days of consolidation. The started with a gap higher and lead indices were able to build on this move, but a one day bounce does not a recovery make.  The Russell 2000 ($IWM) is the underperforming index, and while it did gain over 2% it stalled at its 200-day MA. Volume was well down on previous selling, reflecting a lack of conviction on the part of buyers. Technicals have been negative for a long while and there wasn't much of a improvement today.

Nasdaq breaks support as the Russell 2000 continues to fall

Image
Indices continue to fall as traders grab profits before the holidays. While the Russell 2000 is the index feeling the most pain it handed the headlines over to the Nasdaq on Friday when it undercut its 50-day MA, on higher volume distribution. Technicals are net negative, but internediate term stochastics are not oversold.  The index is underperforming relative to the S&P as it works its way towards its 200-day MA.

Russell 2000 Rout

Image
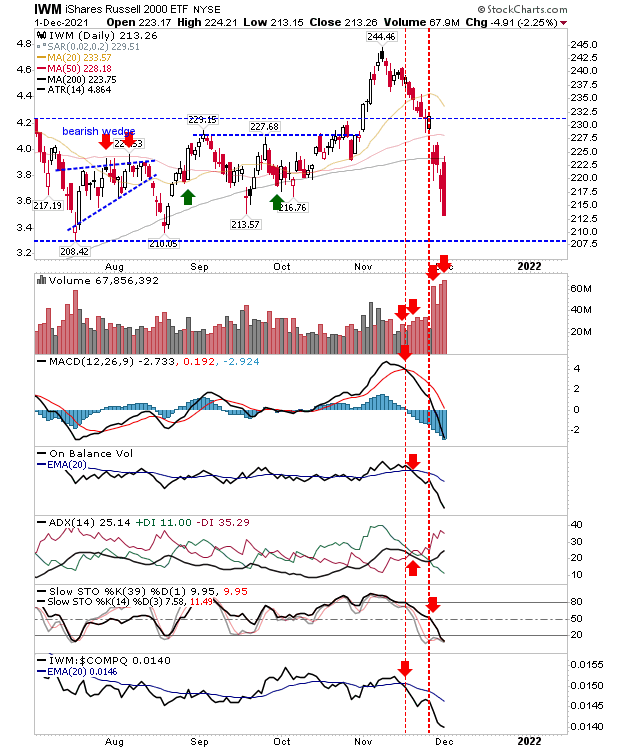
There was little doubt about who was in control of markets today.  Sellers swooped in across markets but it was the Russell 2000 which took the worst of it.  There was a brief attempt to recover the 200-day MA, but aside from that it was sellers all the way.  Volume rose to register as distribution, adding to the malaise in the market.  Technicals are net negative, but stochastics are oversold and a rebound is not far off. 

Archive

Show more