Posts

Showing posts from May, 2018

Sellers Challenge Breakouts But Markets Hold On

Image
Trump's tariffs sent markets on a bit of a spin but total selling, while ranked as distribution, didn't go above 1%. More importantly. the bullish setups from yesterday remain valid. Loses in the S&P took the index back to challenging the 'bear trap'. An open around 2,700 could offer a discounted long opportunity.

Small Caps Follow Through; 'Bear Trap' in S&P

Image
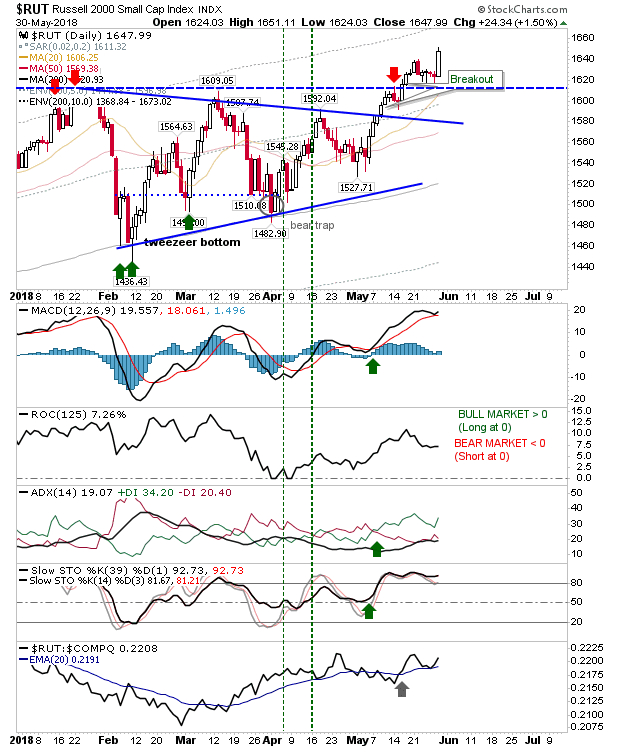
Yesterday had opened up bearish opportunities in Large Cap Indices but it was the Russell 2000 which ultimately delivered in favour of bulls. The Russell 2000 followed yesterday's successful test of support with a 1.5% gain today. With no overhead resistance and net bullish technicals there isn't any clear point of weakness.

Large Caps Signal Trouble

Image
There was a shot across the bows from Large Cap indices as the consolidations which were playing out the last few weeks took a step south.  For the S&P this amounted to a clear breakdown and the risk is further losses to take things back inside the 2,575-2,675 range; however, if this does occur I would look for further losses as the momentum which drove the initial advance fades. Not surprisingly, today's breakdown also came with technical 'sell' triggers for MACD, On-Balance-Volume and +DI/-DI

Base Building Continues

Image
Another Day inside the trading range, another day of waiting. Not a whole lot to say about Friday. The S&P remained tightly bound and confined to a narrow horizontal range. On-Balance-Volume switched to a 'sell trigger' as other technicals remained positive. The preferred trade is still an upside breakout from the hande.

Second Day of Bullish Defense

Image
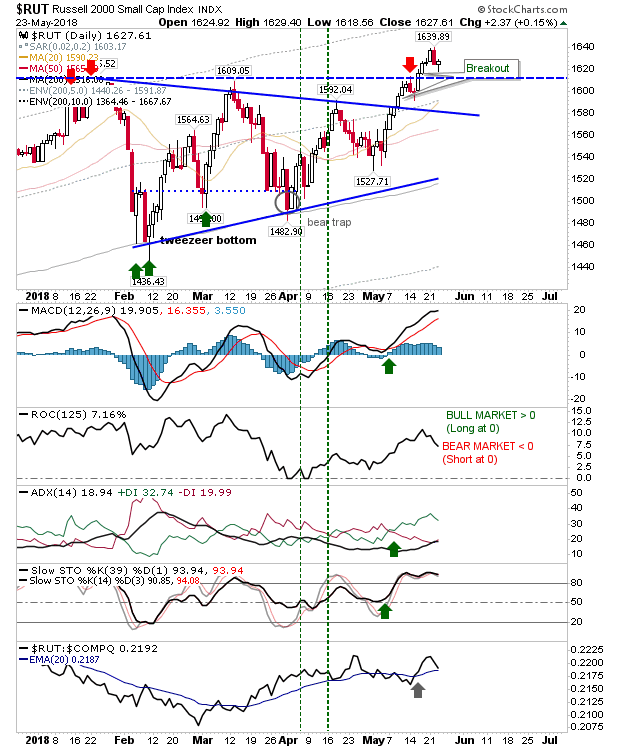
The market had initially reacted to Trump's decision to cancel his North Korean summit before coming to its senses and finishing where it left off yesterday. For the Russell 2000 it was a bullish doji to follow the 'hammer'; those brave enough to buy the morning dip will be feeling confident as technicals remain bullish.

Successful Test of Breakout for Russell 2000

Image
Yesterday's losses were reversed by a decent recovery which effectively confirmed trading ranges and in the case of the Russell 2000 tagged breakout support. The small 'hammer' in the Russell 2000 is a picture-perfect reaction to the breakout.

Narrow Trading Ranges Set Up New Breakout Opportunities

Image
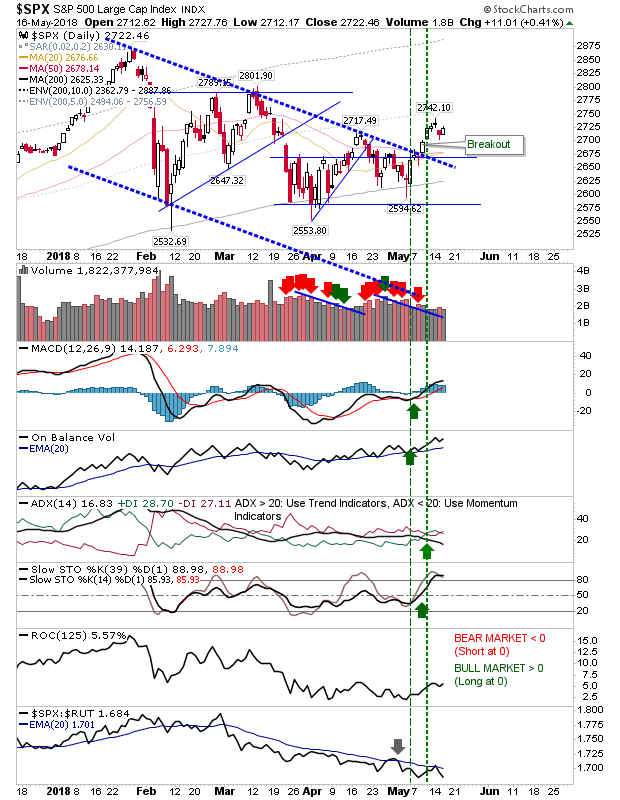
The past few days have seen markets shape narrow mini-trading ranges, each following breakouts from larger consolidations. Large Caps show this best The S&P cleared a dual 4-month and 6-week consolidation before shaping the past 8-day 'flag'. Look for a break of 2,740 and a push to challenge the next swing high at 2,800 - although a test of this should be enough to go on and challenge all-time highs.

Bulls Step In - Easing Bearish Concerns as Small Caps Breakout

Image
Monday offered the bearish doji / swing high set up which had looked like it was going to create the 3-day bearish evening star set up across markets; this pattern did present itself Tuesday with the gap downs but today (Wednesday) saw rallies which were enough to close these gaps but not enough to negate the 'bearish evening star' setups. However, the bearish 'evening star' is typically a reliable setup and the lack of follow through lower suggests more upside is to come The S&P had its breakout last week with supporting technicals all bullish, with the exception of relative performance. Despite this, look for a continuation of this rally.

Bearish Candlestick Creep

Image
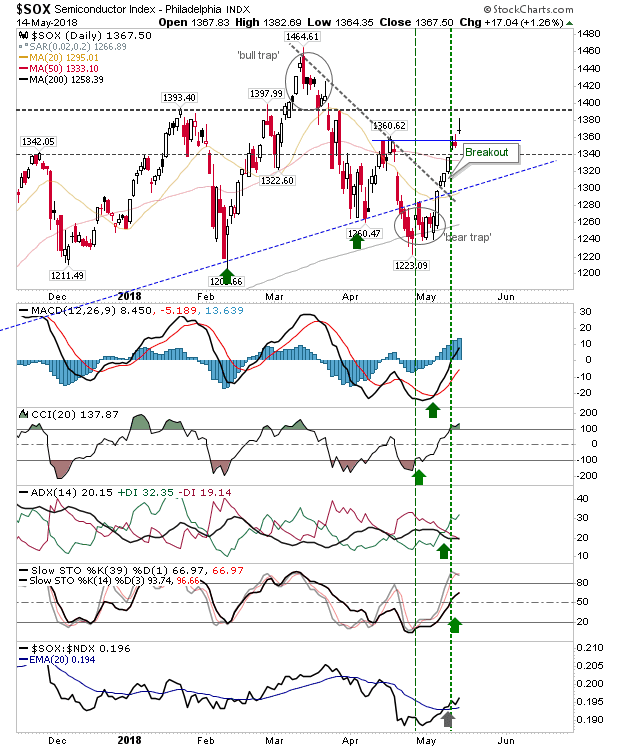
Friday's action was a case of status quo but Monday pushed things more towards bear's favour; the series of doji and one gravestone doji are more in line with a swing highs. It does give a bulls a chance to negate what are typically bearish signals, particularly as these rallies are still relatively young. The gravestone doji manifested itself in the Semiconductor Index. While today's action also marks a short term breakout it's looking more likely to be a swing high; look for a gap down tomorrow (to leave a potential bearish 'evening star').

Friday Consolidation - Small Caps Ready To Lead

Image
Not every day can be a headline day and Friday was one of those days. the only action of note was the breakout in the Nasdaq Summation Index. Technicals aren't fully bullish but the consolidation breakout should help the Nasdaq and Nasdaq 100.

Breakouts For S&P and Russell 2000

Image
The S&P, Dow Jones Index and Russell 2000 all delivered clean breakouts on bullish technicals. Best of the Breakouts was probably the Russell 2000.  The only disappointment was the relative loss against the Nasdaq. However, the index is ready to challenge January highs and resume the prior bullish trend.

Russell 2000 and S&P Prepare for Breakout

Image
Despite the exit of U.S. from the Iran Deal there was no real damage done to the market. In fact, some indices are well positioned to benefit. Best of these looks to be the Russell 2000. Today's close left the index right against triangle resistance with a fresh MACD trigger 'buy' along with a similar trigger for the +DI/-DI.  This helped tick relative performance in Small Caps favour.

Bulls Make Solid Gains

Image
A solid close to the week helped advance Thursday's recovery. Tech Averages had the best of the action. Any short trades should be covered as the nature of the price action has shifted more sideways/bullish. The Nasdaq 100 cleared declining resistance with a new bullish cross in relative performance. There was also a 'buy' trigger for On-Balance-Volume and MACD. Next tests are 6,856 and 7,000.

More Demand Buying

Image
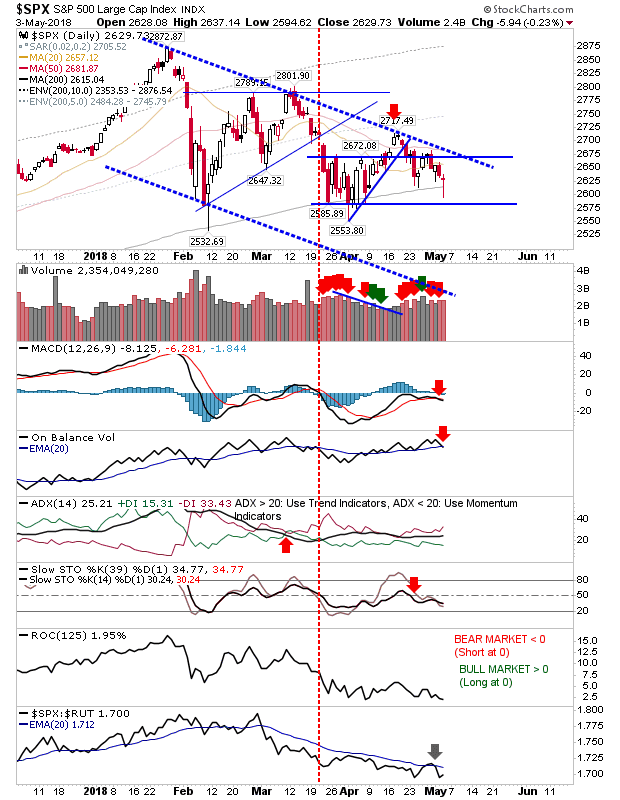
Tuesday's round of buying didn't last long as sellers took another swing at pushing prices lower yesterday. However, today's buying was a little more appetizing for bulls. The S&P generated another spike low, this time with a doji at the 200-day MA. Technicals did turn net bearish and relative performance has remained weak since the larger triangle/wedge breakdown in March.

Better from Bulls - Shorts Failing to Apply Pressure

Image
Since the breakdown in wedge support it had looked easier for bears to push indices down to 200-day MAs or lower channel support but action over the last week with two bullish hammers suggests longs may have a launch pad to work with. The S&P is offering a nice setup with the 'bullish hammers' just above the 200-day MAs. The only disappointment was the 'sell' signal in relative performance in the Russell 2000.

Archive

Show more