Posts

Showing posts from July, 2015

Markets Remain Near and Above, Yesterday's Highs
Image
Tech indices finished strong after they overcame the opening half hour of selling. The Fed statement was greeted favorably , although market breadth is not looking pretty. The Nasdaq still has a distance to travel to make back all of its losses, but has done well to hold up against Semiconductor weakness.

Second Day of Gains

Image
Another round of buying swept through Large Cap indices, but other indices didn't enjoy the same level of interest. The S&P had the best of it. Since the middle of July it has enjoyed a strong advance relative to Small Caps and Technology indices, but it may be time for it to revert to mean. Technicals are a little scrappy, but are holding to the bearish side, but one more day of gains could swing it back in bulls favour.

Relief Rally?

Image
Big gains and a strong reversal in the Russell 2000 puts a potential bottom in play.  The Russell 2000 started the day below the 200-day MA, but then rallied to claim a spike low and a close above this key moving average. Small Caps are a key driver in trend cycles. The 'bull trap' from June is still dominant. and a push above 1,280 looks a tall order. but reversing the breakdown of the rising trendline at 1,240 is a different proposition. If it fails at this, then a swift return below the 200-day MA, and then some, opens up. And the long awaited intermediate term decline begins.

Fifth Day of Selling

Image
Sellers in the S&P made it five days of downside in a row. On this last day it closed near the day's lows, but also on its 200-day MA. If there was reason for a bounce, then tomorrow could be the day.  Technicals are all net negative.

Broad Selling

Image
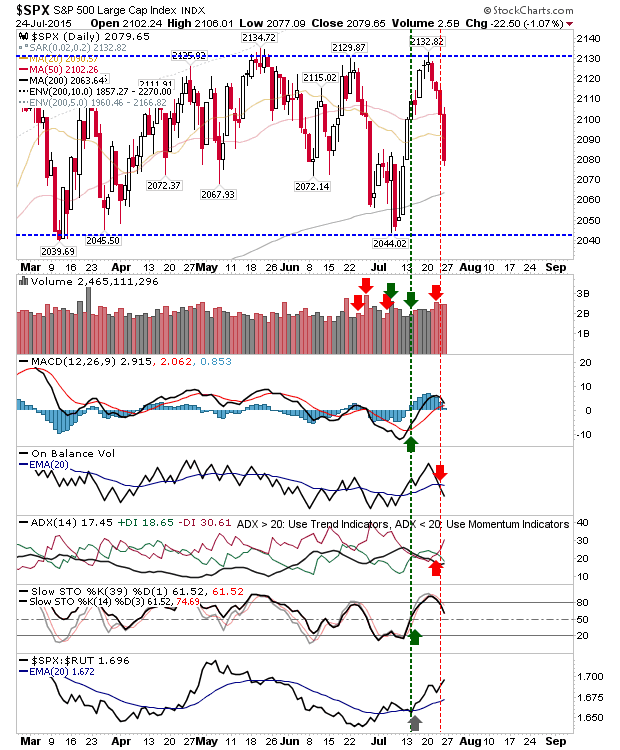
There was no doubt as to the nature of Friday's action. A weak, end-of-week close adds to the negative tone, suggesting the damage is more long term. However, not all indices are in true bearish mode. The S&P is stuck inside its range, and won't be challenging range lows until 2,045 comes into play. The 200-day MA at 2,063 is an area to look for buyers, although the last test of this key moving average was in early July, which is a little too soon for a new test to hold again. Technicals are mixed, which fits with what is trading range action. Bears may win in the long term, but bulls may get some joy at the 200-day MA for a short term bounce play.

Selling Continues

Image
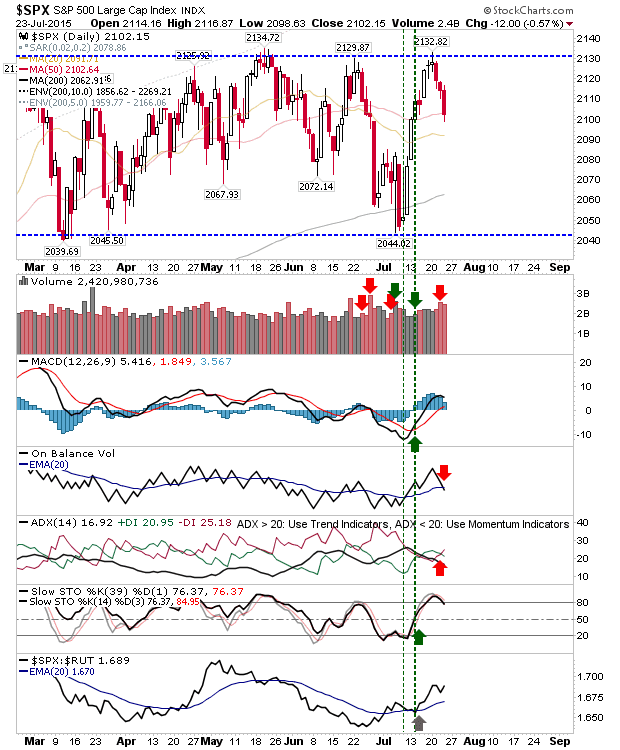
Bears keep the pressure the on with another around of selling. Markets remain range bound, particularly after July's sell off and recovery, which confirmed market trading ranges. The S&P finished at its 50-day MA on lighter volume selling. Beyond the 50-day MA next comes the 20-day MA, but neither MA has played as support in recent months.

'Bull Trap' in Nasdaq

Image
There was some spill over from yesterday's after hours disappointment in Apple, but after a weak open, bulls were able to mount some challenge by close of business. However, today's close was still below that of yesterday and registered as distribution. Hardest hit was the Semiconductor Index. It experienced a gap down, shedding 2.5%, as it continues to trend lower. Given the extent of the decline it's hard to see how the Nasdaq and Nasdaq 100 can continue to trade near yearly highs.

A Bad Earnings Day, But A Good Day For Profit Taking

Image
A bad day for earnings, with IBM, United Technologies and Apple all disappointing. With indices at highs (or just shy of resistance) it was going to be a day of easy selling.  With technology particularly hard hit, the Nasdaq did well to cling on to its upside breakout, but given Apple's earnings were after hours it's unlikely to be the same story tomorrow.

Gains Contained

Image
Monday was a continuation of Friday's action: gains for S&P and Nasdaq, losses for Russell 2000. The issues in play at the start of the day, remain in play at the close. The Russell 2000 is perhaps the most worrying of the indices. Today's losses took the index back to the 50-day MA, but with the index stuck inside a trading range this moving average is unlikely to play as major support. Technicals are also a little iffy: a 'sell' in the ADX is coming up against a potential 'sell' in the MACD, and relatively neutral CCI and Stochastic. The worst of the action is the sharp relative under-performance against the Nasdaq.

Tech Indices Breakout

Image
Netflix and Google offered the juice to drive the Nasdaq and Nasdaq 100 to new highs. Other indices aren't there yet, and it remains to be seen what they can offer. Friday's finish in the S&P left it just below resistance near 2,130. Technicals are net positive, and whatever bearish connotations were there from the loss of 2,080 have been firmly put to bed.  Friday's doji marks indecision on the part of bulls and bears, with Large Cap traders looking at whether Tech indices can hang on.

Third Day of Gains

Image
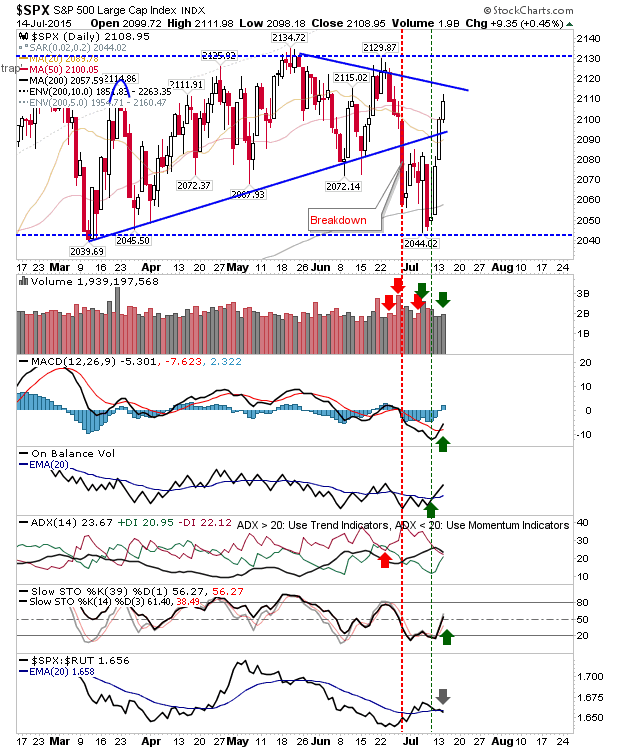
Just when it looked like Greece and/or China were going to bring the long awaited decline of substance, along come bulls to bid up three solid days of gains. Tuesday's rally was enough to register an accumulation day to boot. The S&P is close to tagging declining resistance from the May-June swing highs. Will bears look to attack here? Technicals have seen some improvement with a MACD trigger and Momentum 'buy', although relative underperformance against Small Caps expanded.

Greece 'Deal' - Rally Continues

Image
While the new bailout hasn't been approved by Greece, a new deal is on the table. China looks to have been pushed to the back of the headlines, but it hasn't disappeared either. Either way, bulls took weekend news to push with Friday's gains. Indices have closed key breakdown gaps which have overshadowed markets in recent weeks. The S&P is back at its 50-day MA and has room to maneuver to declining resistance defined by May and June swing highs. Buying volume has dropped after 2 days of gains, so bulls are not yet convinced by the last two days of action, but remember, rallies climb a wall of worry.

Scrappy Consolidation, But Greece In Play

Image
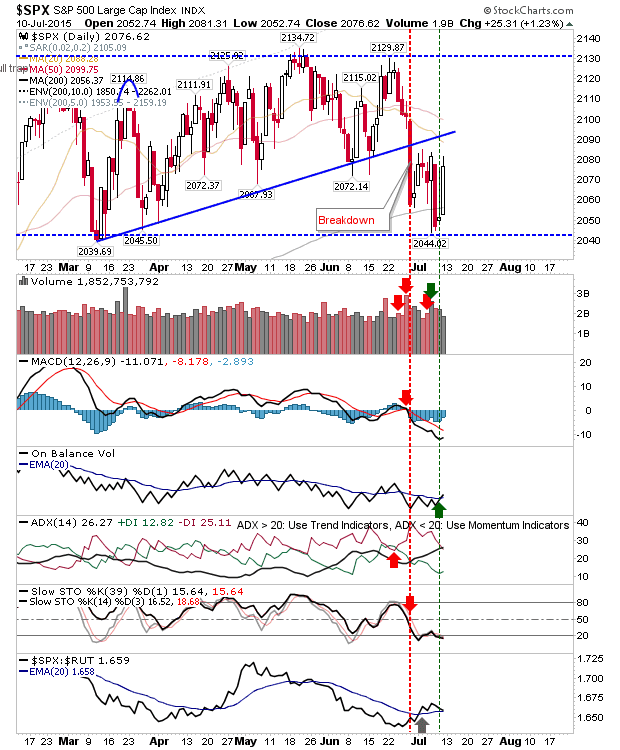
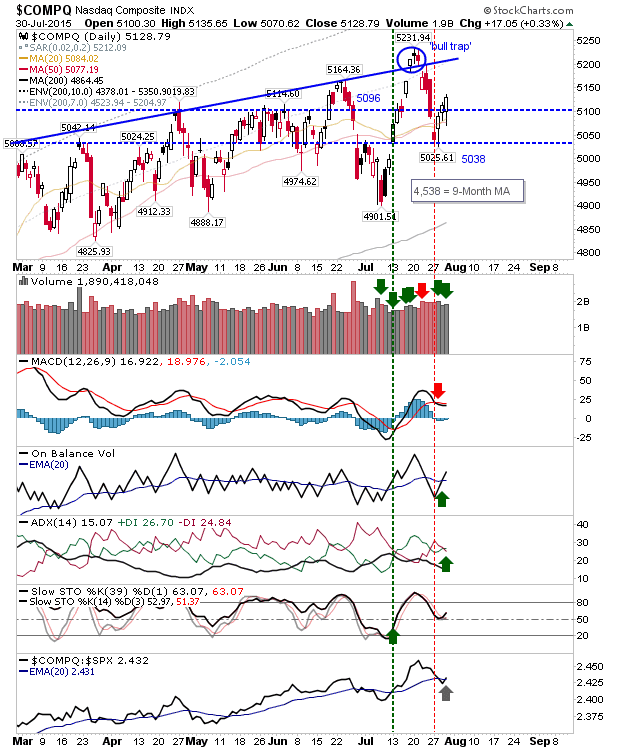
It's not looking good for Greece with Germany holding out , and last week's big swings without any significant change in price is going to change next week. The break down from the end of June looks likely to hold out, and this will keep the intermediate down trend in play. Intermediate trends last from 3 weeks to 6 months, and there is probably enough fuel from Greece and China to keep this going into Autumn. Bulls are not entirely out of the game. The S&P is defending its 200-day MA, with a new 'buy' trigger in On-Balance-Volume, and a continued relative advance against Small Caps. Gap resistance is at 2,085. The Nasdaq also saw an On-Balance-Volume 'Buy' trigger, although the latter volume indicator has flat-lined. Gap resistance for this index sits at 5,038 with the 200-day MA the next target down. The Russell 2000 defended trend-line support, but next week will be a tougher test. Such support is unlikely to survive a fourth test. Tech i

Losses Maintained

Image
The back and forth continued, except this time pre-market gains could not be held and markets revisited lows. This lows still hold as support, but it's a tough sell to buyers to want to jump in here. The S&P finished below it 200-day MA with a big inverse hammer.  Technicals are net bearish, except today's action hasn't reversed the net out performance of the Large Caps over Small Caps.

Volatility Picks Up as Gains Reversed

Image
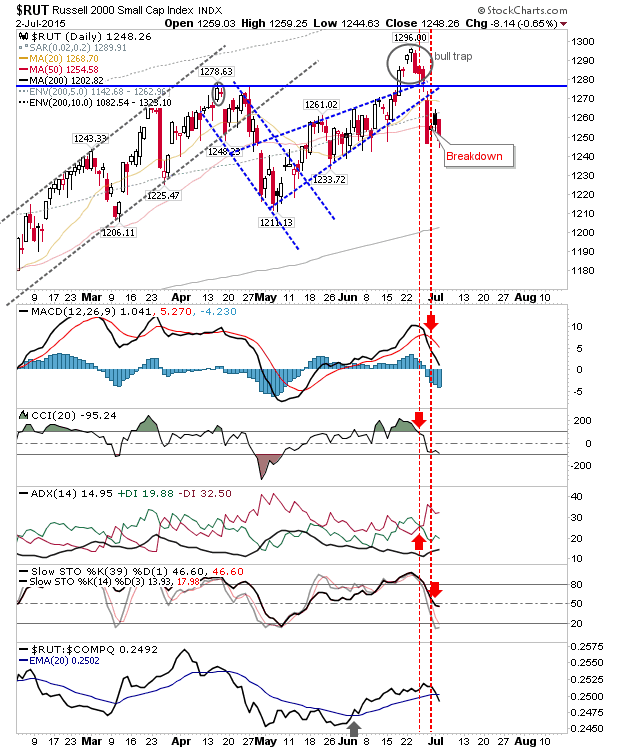
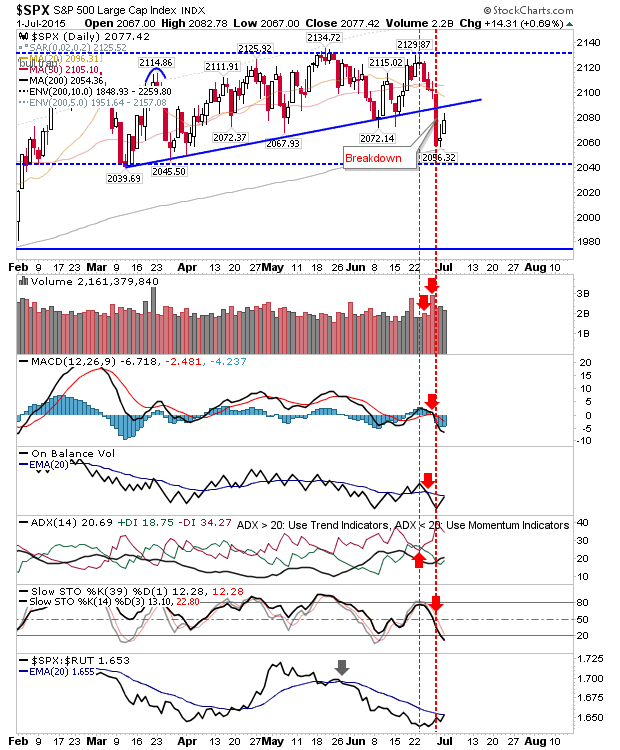
With China vying with Greece for Worst Financial Headline, buyers were hard to find. Yesterday's late surge - typical of capitulations - was completely reversed by today's selling. Where the S&P was knocking on the door of a break of 2085, it instead finished the day below its 200-day MA. It has been a long time since it last trades below this average, but we may be now looking at the start of the capitulation. While losses were big, it maintained its relative strength against the Russell 2000.

S&P To Break 2085?

Image
A huge bullish reversal after an opening sell off leaves things nicely set for bulls tomorrow. The media attributed a recovery in oil prices to market gains (a rare attribution for oil prices!), but whatever the cause it was a big intraday swing. The S&P spiked through 200-day MA support on heavy volume accumulation. Other technicals are net bearish, although the index is enjoying a relative performance against Small Caps.

Modest Selling When Worse Was Expected

Image
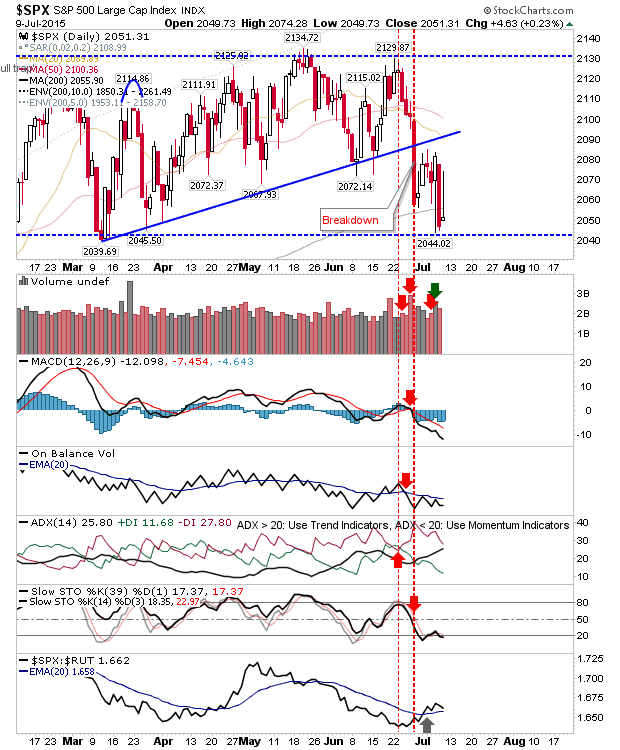
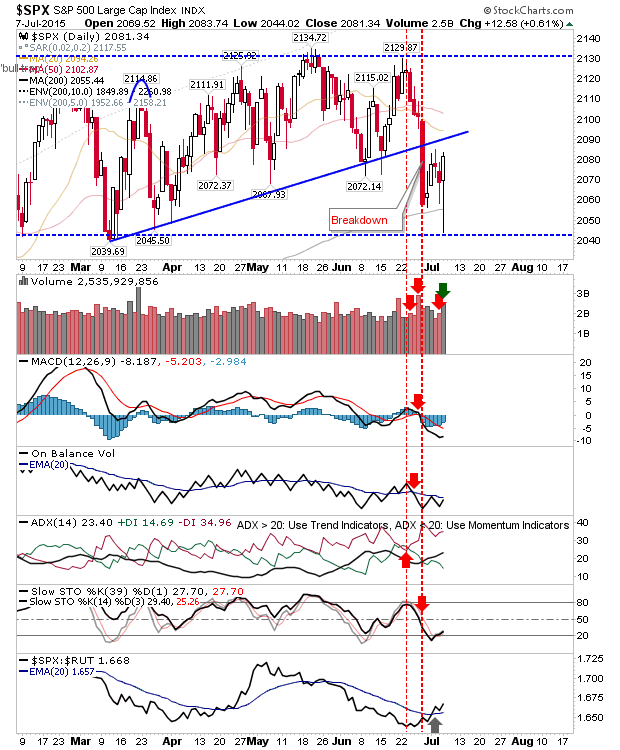
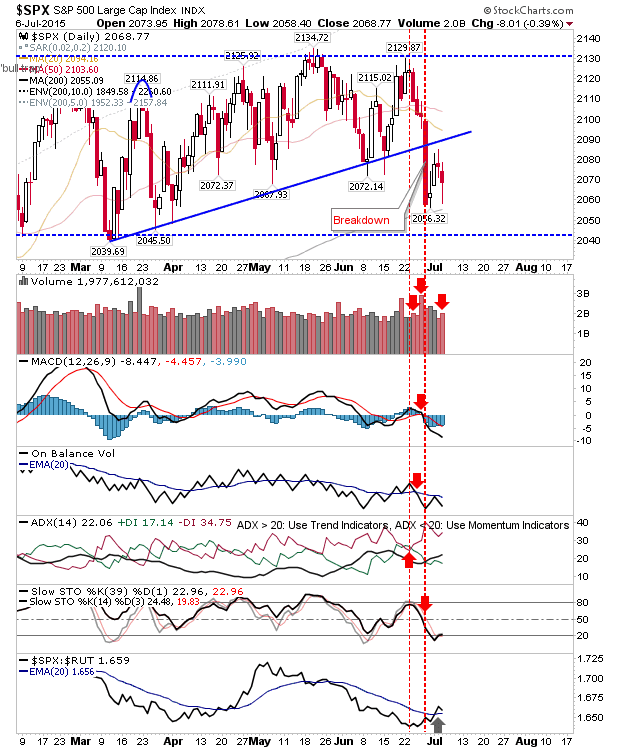
Hard to say if bears have had enough or are just waiting for worse news to follow, but the Greek referendum didn't have too much of an impact on Monday's action after the long weekend. In the case of the S&P, early losses didn't go as far as to tag the 200-day MA, but the 200-day MA has played as support. Technicals remain next bearish, and the swing low at 2,039 is calling. Volume climbed to register net bearishness, although there is a relative loss in performance against the Russell 2000.

Neutral Day

Image
After yesterday's gains there was no more gas in the tank to squeeze any more out of the market. Worryingly, the Russell 2000 finished near Monday's lows in a relative loss to S&P and Nasdaq, suggesting bearish leadership will come from speculative Small Caps, and that further losses are likely.

Weak Bounce

Image
The bounce wasn't particularly strong and volume was down on yesterday. Today's action keeps resistance in play, and maintains the dominance of Monday's sell off. The S&P tagged 2080 resistance, before reversing. Technicals remain net negative.

Archive

Show more