Posts

Showing posts from January, 2014

Sector Analysis: Utilities Out in Front

Image
Not surprisingly, there has been a dramatic fall in the level of bullishness within sectors over the past 10 days. However, one sector which has managed to keep its nose in front is Utilities ($XLU). Select the 'Utilities' option in the bubble chart below (don't work in Firefox - talk to Google/Firefox as to why!), and watch how it moves from a middling, slightly under-performing, sector to sector leader.

Daily Market Commentary: Bulls Try Again

Image
Tuesday's halt of the decline didn't stick, but Thursday's buying looks to have more metal behind it. For starters, the Russell 2000 rallied enough to create a 'bear trap'. The index now has a 'bear trap' and a 'bull trap' to contend with. But bulls have a handy edge, with the 50-day MA to become Friday's battle, and the 20-day MA next weeks'. Stops go on a break of 1,119.

Daily Market Commentary: A Bearish Twist

Image
It proved to be a tough day for bulls. Shorts are unlikely to have been the cause of today's losses, although some may not have wasted time jumping on board. Apple's poor results were probably a cue for some long-term holders to bail out, although Fed action and international currency woes were also put forward as excuses, but collectively, this caused the nascent rally to breakdown.  Volume climbed in confirmed distribution, setting up tomorrow for more of the same. Technical weakness in the S&P intensified, although bulls will look to a third day of held support despite the 1% loss on the day. Aggressive longs could look to buy this support on Thursday with a relatively tight stop available. Again, if there is any downside follow through on today, you probably wouldn't want to hold long into the morning session if no fightback was observed. However, a gap down at the open would be an interesting long opportunity.

Daily Market Commentary: Low Risk Bounce

Image
Bulls should have some wiggle room here. Shorts won't like the risk:reward until a rally takes the indices back to 20-day MAs. Until then, bulls can probably be fairly aggressive for the next couple of days. Today was a good start, and yesterday's lows offer the stop placement (with today's lows perhaps the raised stop going forward). Technicals for the S&P are bearish, but with the 50-day MA some 20 points away it's more likely the rally will continue for a little longer.

Daily Market Commentary: Russell 2000 Finished on Channel Support

Image
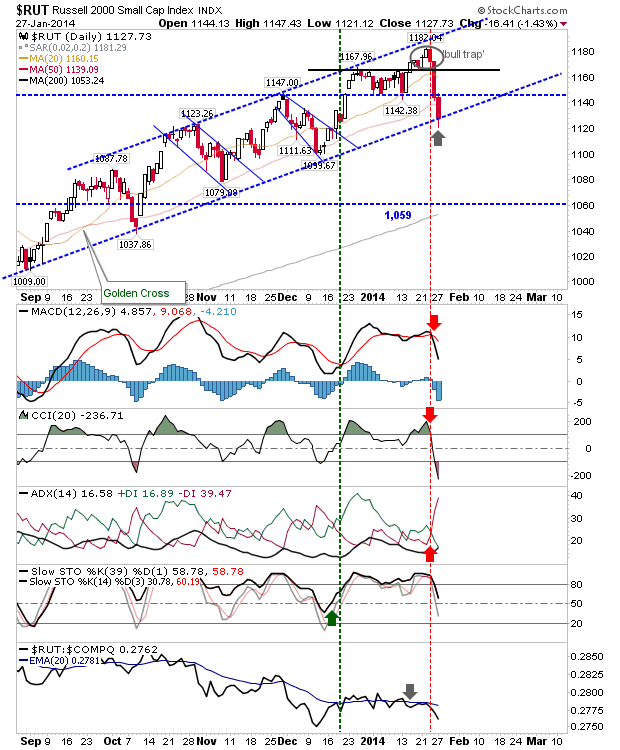
It was another round of losses in what proved to be a not-so-quiet Monday.  Even with the losses, the index best set for a recovery is the Russell 2000.  Today's losses took it all the way down to, and below, its rising channel; but a late day recovery brought the index back to this support level.

Daily Market Commentary: Breakdowns

Image
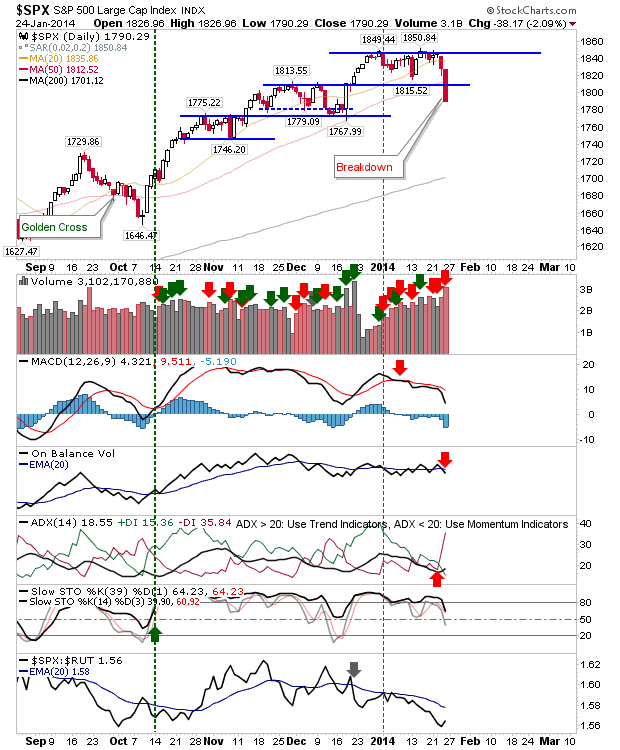
Friday saw big losses across the board. It has been a long time since bears have had much influence as they had on Friday. Breakdowns abound, and areas of overhead supply were created where before there was none. The S&P sliced through the low end of its range and through its 50-day MA on higher volume distribution.  Not surprisingly, technicals weakened, but are still net bullish.  The 200-day MA is the long term target, with rallies likely to struggle once the 20-day MA is reached.

Daily Market Commentary: Large Caps Sell Off

Image
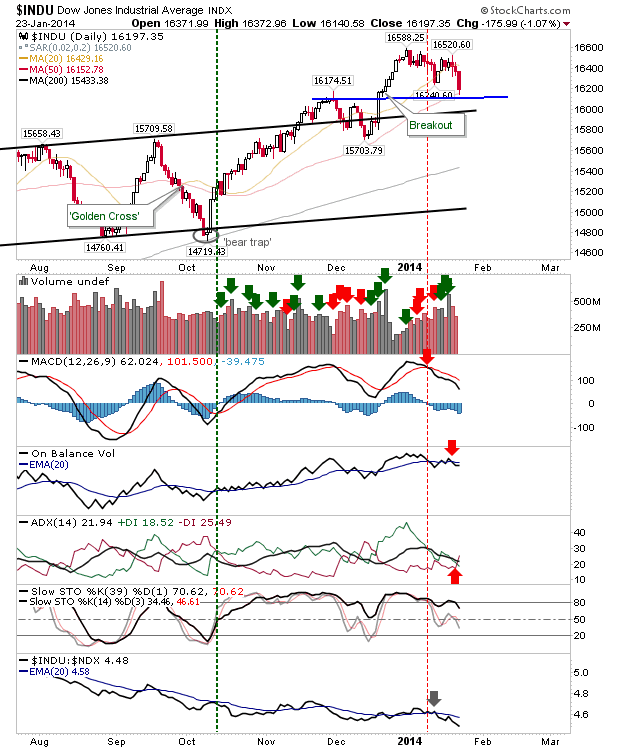
It was billed as a slump , but markets experienced losses well within their bullish boundaries. The Dow Jones Industrial Index experienced the largest loss, but it stopped at its 50-day MA, and above horizontal support. With the exception of stochastics, all technicals are bearish. However, bulls maintain their advantage unless support is lost.

Daily Market Commentary: Semiconductors Charge Again

Image
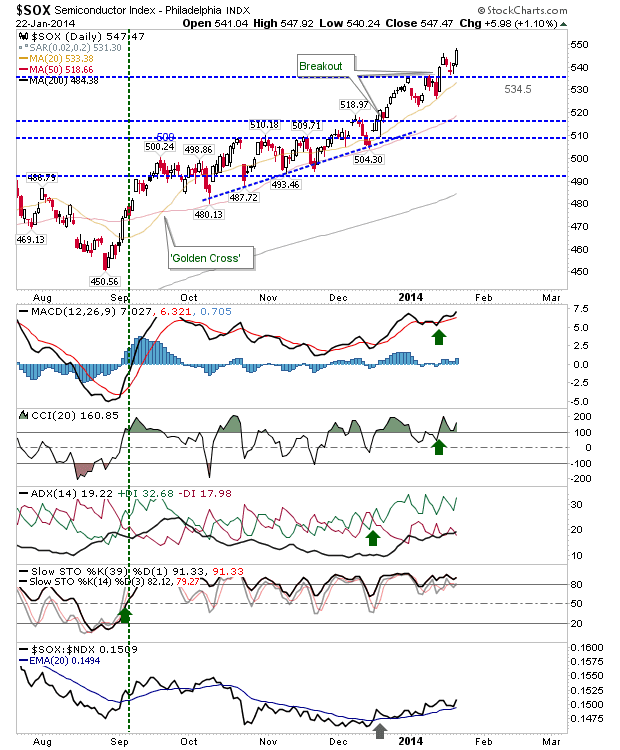
Since the New Year rolled in it has been semiconductors which have done most of the leg work for this rally: a solid 1% gain following last week's breakout is just the tonic for a technology rally: The gain in the semiconductor index was supported by technicals. Gains in the semiconductor index helped the Nasdaq 100 finish on a new high. And the Nasdaq The Russell 2000 wasn't left out with a decent gain of its own: nothing to spectacular, but enough to keep bulls interested. Only the S&P was left out in the cold. It managed a small gain, but was unable to break resistance. Play for a breakout in the S&P on Thursday.  However, the Nasdaq may be set for a flat close as it hangs on to today's gains ---- All Contributions Welcome - Thank You! Follow Me on Twitter Dr. Declan Fallon is the Senior Market Technician and Community Director for Zignals.com . You can read what others are saying about Zignals on Investimonials.com . JOIN ZIG

Daily Market Commentary: Small Caps Stay Ahead

Image
There wasn't much to today's action. The only real important aspect was the recovery from the morning sell off, but it wasn't enough to translate into any real end-of-day gain. The S&P was unable to break from its consolidation:

Daily Market Commentary: Consolidation

Image
No real surprises. Tech and Small Caps continued to lead Large Cap stocks, and while volume climbed (to register distribution), the point loss was light. The S&P suffered a 'sell' trigger in On-Balance-Volume as the MACD trigger 'sell' expanded. The index was able to finish on its 20-day MA, offering a point of support for Monday. The index looks to be shaping a new consolidation; with resistance at 1,850 and support at 1,820 (although it could post intraday lows around 1,810). Risk measured on loss of 1,810.

Daily Market Commentary: Minor Changes

Image
Today consolidated Monday's reversal swing with low volume, minor losses for the S&P, and small gains for the Russell 2000 and Nasdaq. The rate of advance has not surprisingly slowed, setting up tomorrow for a chance of small losses. The Russell 2000 successfully tested breakout support with all technicals net bullish. Bulls probably have the best opportunity to bank gains in this index tomorrow.

Daily Market Commentary: No Rest For Bulls

Image
It was more of the same for the semiconductor index. Yesterday's breakout was followed by some decent action, further improving the technical picture for this index and offering a strong foundation for additional gains in the Nasdaq and Nasdaq 100.

Daily Market Commentary: Bulls Didn't Give Bears a Chance

Image
Bears were unable to follow through on yesterday's selling. The morning gap set the tone, and buyers kept the momentum into the close, regaining (and in some cases, exceeding) yesterday's losses. The semiconductor index led the charge, breaking to a new high. The earlier bearish 'sell' signals in the CCI and MACD were reversed on today's gain.

Daily Market Commentary: Big Losses

Image
Surprising losses when markets were set up for gains. The losses were substantial, fueled by upcoming earnings rather than any confirmed bearish action. The S&P fell back-and-below its 20-day MA, setting up a test of its 50-day MA. There is a MACD trigger 'sell' to navigate, with a pending bearish cross in +DI/-DI on the way. Given the degree of losses, it could come back to its 50-day MA by the end of the week. The Russell 2000 also had a rough day, although it didn't fall enough to violate the breakout. The index closed at its 20-day MA. If bulls are to mount a challenge, this is the index to do it. The Nasdaq took the hardest hit. It lost the converged support, and overshot the 20-day MA on higher volume distribution. The 50-day MA is next up at the target Prepare for some fight from bulls, because it looks like they were taken by surprise today on the selling, and failed to generate the afternoon buying which occurred in previous days. However, bea

Daily Market Commentary: Tension Keeps Building

Image
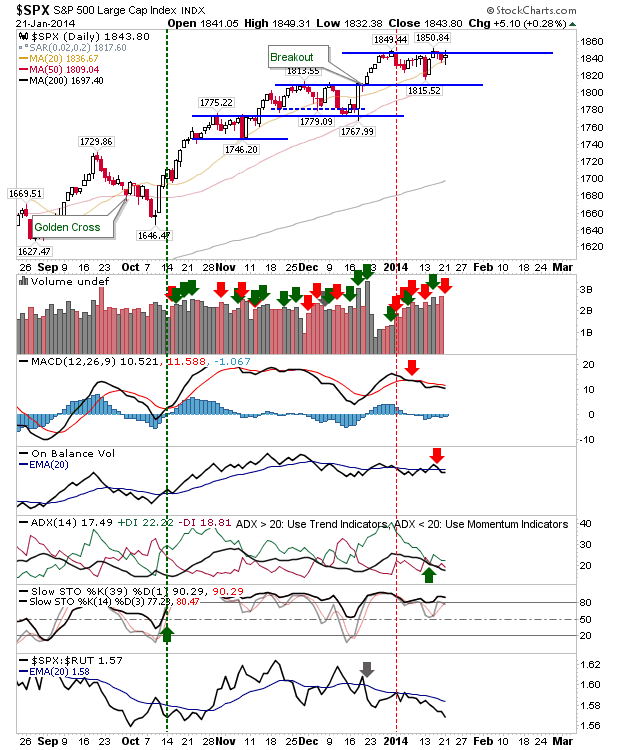
The market looks like it wants to go higher, but nobody wants to be first through the doors. Modest gains covered the decent intraday recovery: whatever about end-of-day gains, intraday action is firmly with bulls. The S&P reversed its On-Balance-Volume 'sell' and is about to do the same to the MACD signal. Be ready for upside on Monday.

Daily Market Commentary: Large Caps Remain Primed For Gains

Image
It proved to be a tougher day for Tech stocks than Large Caps. The upside follow through didn't occur, but there was a divergence between losses for Tech stocks and a more neutral, flat day for Large Caps. The S&P did lose out in morning action, but was able to recover those losses by the close. 'Sell' triggers for the MACD and On-Balance-Volume remain, but the former looks set to whipsaw if the S&P posts even a small gain.

Daily Market Commentary: No Late Buying

Image
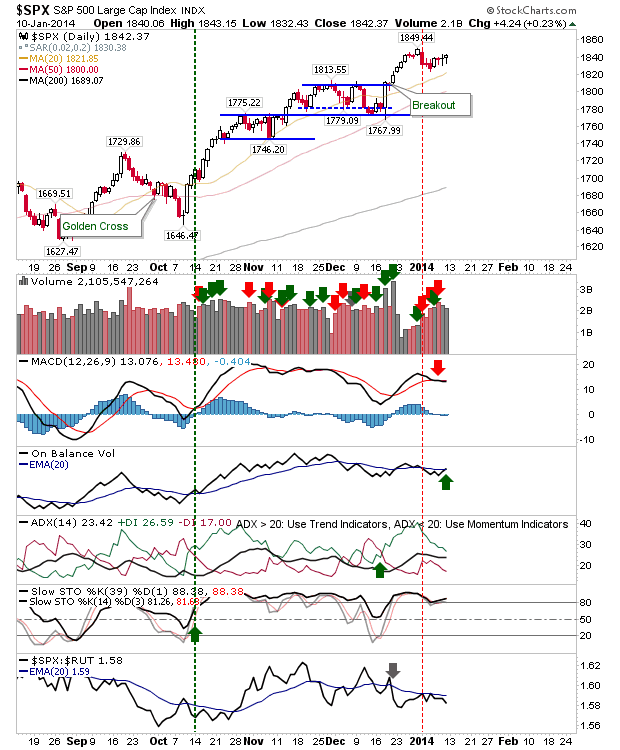
The day set up nicely for an afternoon follow through by bulls, but it never arrived.  However, bulls did manage to do enough to set up a follow through for tomorrow. Bulls could push this from the off in morning trading; if so, a break of Wednesday's lows can be used for stops. The S&P is nicely poised for gains. The MACD is ready to bounce despite the negative cross, and On-Balance-Volume is about to trigger a 'buy'. It looks a relative low risk play on the long side for a push to new highs. But be prepared if lows are taken out quickly.

Daily Market Commentary: Modest Recovery

Image
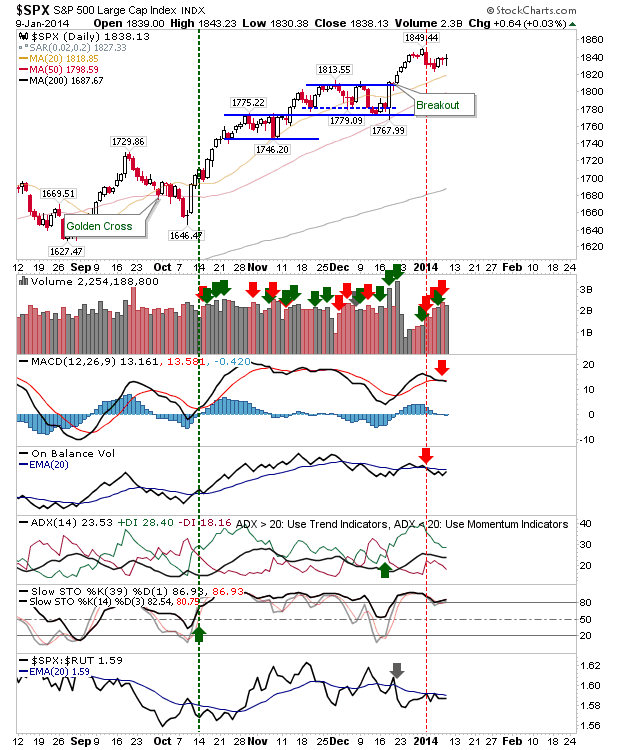
Indices staged a modest recovery, stemming a brief sequence of losses. Long traders can use yesterday's lows as a risk measure, working a potential swing low.  The bounce in the S&P occurred well above support, but it's looking like a good opportunity.

Daily Market Commentary: Third Loss in a Row

Image
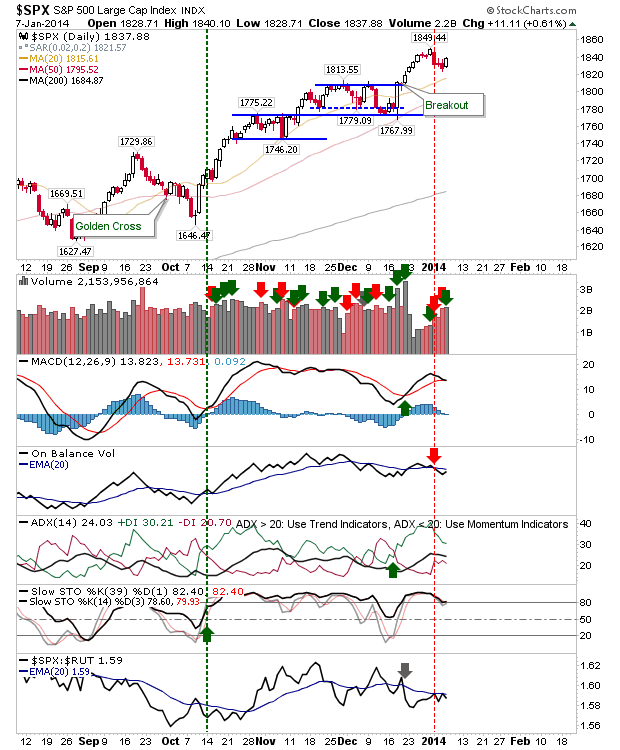
Today saw further small losses, to the point the Nasdaq is making a test of channel support, and the Nasdaq 100 is down at its 20-day MA. The Nasdaq 100 also saw 'sell' triggers in its MACD and On-Balance-Volume.

Daily Market Commentary: Further Light Losses

Image
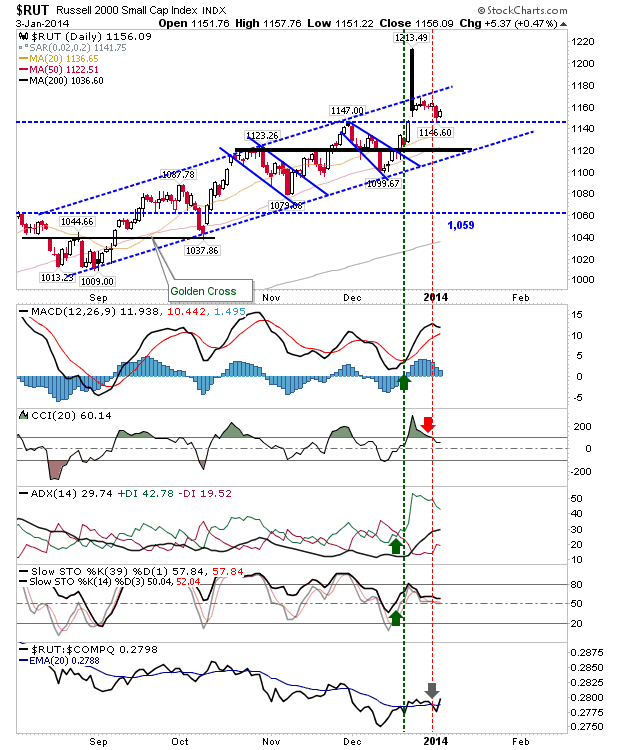
Next week will set the real tone for the year, but for Friday it was yet another day of modest losses. The only index to escape the selling was the Russell 2000.  It managed to finish with a small gain as it started the day nearer to support. The gain in the Russell 2000 didn't change the technical picture a great deal, although it did enjoy a substantial jump in relative strength against Tech indices, and to a lesser degree, Large Caps.  Will this shift help reverse a two month relative underperformance to these indices?

Daily Market Commentary: Slow Start to New Year

Image
A modest loss on light volume to start the year was not surprising given the end-of-year gains leading up to 2014. This hangover may see indices come back as far as their 20-day MAs, but there wasn't enough on offer to suggest panic is going to take hold.  Taking profits on gains booked over the last few months remains the most pragmatic approach to adopt until support levels are tested. The S&P registered a modest 'sell' trigger for On-Balance-Volume.

Daily Market Commentary: 2013 Finishes On A High

Image
End of year window dressing favored Large Caps as both the S&P and Dow Jones Industrial Average finished the year at new all-time-highs. There was more muted action from Small Caps, although Tech averages also got their share of the action. The S&P finished the year more than 10% above its 200-day MA; typically a time to be taking profits rather than buying. If the S&P can hold above 1,846 on January 2nd, the index will be then be entering its sixth year of consecutive years, when the S&P had a month when it was 10% or more above its 200-day MA -  the longest sequence dating back to 1950 (earliest data - likely longer in real terms).  The last accumulation signal (S&P 10% below its 200-day MA) was in October 2011, although the longest gap between accumulation signals was a 11 year period from 1990 to 2001.  However, the median gap is 2 years, and at 6 years+ this rally is getting long in the legs.  The last six year gap between accumulation signals was from 1975 t

Archive

Show more