Posts

Showing posts from March, 2012

Daily Market Commentary: Losses Recovered

Image
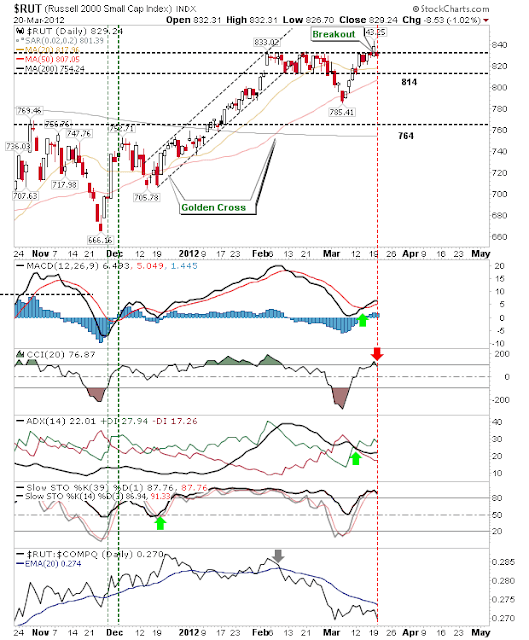
By lunchtime today it was looking like the day would belong to bears, but bulls were able to step up in afternoon trading - perhaps fearful of missing out on any more of this rally (given the rally maturity). But it wasn't all good news for bulls. The S&P was able to defend its 20-day MA, but not before on-balance-volume triggered a 'sell' to follow the earlier 'sell' trigger in the MACD. The Nasdaq followed the S&P with a 'sell' trigger in its on-balance-volume, although other technicals remain bullish. With the Percentage of Nasdaq Stocks above the 50-day MA trading at support once more; this offers a support 'buy'. But breadth support is offset by the potential 'bull trap' in Tech bellwether Semiconductor index. If bears aren't to be encouraged to go short there will need to be a rapid return above 440.  Bulls can look to the 20-day MA as an area for stop placement Finally the Russell 2000 experienced a &#

Daily Market Commentary: Confirmed Distribution

Image
Today's selling didn't result in significant point losses for the indices, but the volume was enough to rank as distribution for the S&P. The S&P also suffered a MACD trigger 'sell' with a relative swing away from Small Caps to Large Caps (bearish). The Nasdaq also shed 0.5%, but didn't suffer the bearish turn in indicators as for the S&P While the Russell 2000 gave up a little more than the aforementioned indices, but did enough to retain 833 support. In my piece on the Zignals blog I talked about the status of the S&P and its bullish outlook for the coming 12 months. So while the bulls hold short term control, it's not going to be a bad thing if indices enter a more protracted decline. However, neither of these cases are of concern for tomorrow; Thursday's challenge is holding breakout support - the Russell 2000 in particular. ---- Follow Me on Twitter Dr. Declan Fallon is the Senior Market Technician and Commun

Daily Market Commentary: Mild Losses

Image
It was a generally good day for the indices.  Markets were able to finish near Tuesday's highs without losing on heavier volume. Because of this, there was little to report on individual charts. The S&P has its bearish wedge While the Nasdaq is riding its former support line. Helped by the semiconductor index's breakout. The Russell 2000 gave back the most, but the breakout remains valid. Will any of this change tomorrow? ---- Follow Me on Twitter Dr. Declan Fallon is the Senior Market Technician and Community Director for Zignals.com . I offer a range of stock trading strategies for global markets which can be Previewed for Free with delayed trade signals. You can also view the top-10 best trading strategies for the US, UK, Europe and Rest-of-the-World in the Trading Strategy Marketplace Leaderboard. The Leaderboard also supports advanced search capability so you can tailor your strategies to suit your individual requirements. Zignals

Daily Market Commentary: Bulls Move In

Image
This may be a rally running on fumes, but it's not going to go down without a fight.  Sharp gains were again offset by some light(ish) volume, but there was enough momentum to undo the 'Bull Trap' in the Russell 2000 and inch a breakout in the semiconductor index. The S&P is again pushed up against rising wedge resistance.  But there is an important relative shift away from Large Caps to Small Caps which is a net bullish event.  Technicals remain bullish; on-balance-volume is trending solidly higher in favor of accumulation. The Nasdaq enjoyed more of a volume bump against its Large Caps counterpart (bullish).  The rally has taken it well past 3,000 support and has no overhead supply to consider until it gets to 4,250. Helping the Nasdaq rally is the semiconductor index.  I would have liked to have seen a stronger response from buyers given its move to a new 7-year high - but given it has been stuck in the doldrums for so long it's still good news.

Weekly Market Commentary: Breakouts Hold

Image
It was a bit of a mixed bag for indices on the weekly time-frame. Vulnerable Small Caps finished the week as they started, sticking around 830.  This area has been resistance for most of 2012, but larger resistance lurks at 865. The week was a little more sketchy for the Nasdaq. The Nasdaq was able to rally almost 0.5% as it continued to run along wedge resistance. Volume eased, but the index enjoys a well established breakout that could tolerate a 200 point drop and still remain in the bull camp. Interestingly, Nasdaq Breadth - in the shape of the Percentage of Stocks above their 50-day MA - is fishing for a swing low.  This particular index lost ground despite the gain in the parent index. In contrast, the Nasdaq Bullish Percents is shaping a swing high (=> lower prices ahead); although past peaks have been brushed aside relatively easily in the past. Meanwhile, the S&P closed almost 0.5% lower, but has enough wiggle room before it has to test support at

Stock Screen: APL, POT, FCX

I have an article posted on the Motley Fool covering Atlas Pipeline Partners (APL), Potash Saskatche (POT) and Freeport McMoran (FCX).  I have tried to gear it more on the fundamental than technical side given the picks were drawn from a Zignals stock screen I use. You can read the article here . ----- Follow Me on Twitter Dr. Declan Fallon is the Senior Market Technician and Community Director for Zignals.com . I offer a range of stock trading strategies for global markets which can be Previewed for Free with delayed trade signals. You can also view the top-10 best trading strategies for the US, UK, Europe and Rest-of-the-World in the Trading Strategy Marketplace Leaderboard. The Leaderboard also supports advanced search capability so you can tailor your strategies to suit your individual requirements. Zignals offers a full suite of FREE financial services including price and fundamental stock alerts , stock charts for Indian, Australian, Frankfurt, Euronext, UK,

Daily Market Commentary: Heavier Losses But Volume Light

Image
The extent of today's losses increased over yesterday's, but it wasn't accompanied with any great volume. Support at 20-day MAs is still available for most indices and while available it offers the first of many points of attack for bulls. The Russell 2000 was the most vulnerable index heading into today and the groundwork for a potential 'Bull Trap' is now in place.  The gap down puts a bit of space against the ex-breakout which will likely be filled in early Friday trading; the question is whether it can make it above 833? The semiconductor index is sticking close enough to 440 resistance to still offer a good opportunity for bulls.  It may take another pass of the fast rising 50-day MA to stimulate demand to drive the breakout. Of the lead indices, the Dow is the one come under a bit more selling pressure than the others.  It's hanging close to 13,000 support but with 'sell' triggers in the MACD, Directional Index and On-Balance-Volume.

Daily Market Commentary: Quiet Day

Image
In an extension of yesterday, markets saw small losses (or gains) on light volume. The overall picture remained unchanged. The Russell 2000 didn't pull away from resistance and remains positioned to regain its early week breakout. The Nasdaq is hogging former channel support turned resistance, but was able to tick higher.  Volume climbed a little on yesterday's selling. The semiconductor index, like the Russell 2000, is finely poised.  Technicals favor an upside breakout. And strength in the Nasdaq and Nasdaq 100 may filter down to the semiconductors rather than the more normal reciprocal relationship.  Tight trading action supports swing trade opportunities; trade the high/low break with a stop on the flip-side.  Will Thursday offer more substantial movement in the market? Perhaps continue the work bulls started on Monday. ---- Follow Me on Twitter Dr. Declan Fallon is the Senior Market Technician and Community Director for Zignals.com . I offer a r

Daily Market Commentary: Recovers Early Losses

Image
It was a decent show by bulls after a weak open threatened to do more damage.  Indices clawed enough of their losses to finish near Monday's highs. For the weaker of the indices it leaves things a little on tenterhooks.  The Russell 2000 finished just below the 833 area which helped define Monday's breakout.  If this is not to 'bull trap' it will need 833 regained over the next couple of days, or at least not pull away from it (The 20-day MA is looking the natural buffer zone for 'bull trap' confirmation). The semiconductor index is still well positioned to challenge 440.  Yesterday's tight trading suggests there isn't much overhead supply or profit takers left to sell, it just needs to break the psychological 440 barrier to encourage buyer participation from the sidelines.  Technicals are in good shape. One index was able to take something positive from the day. The Nasdaq 100 continued its advance, even managing to score a modest accumul

Daily Market Commentary: Small Caps Breakout

Image
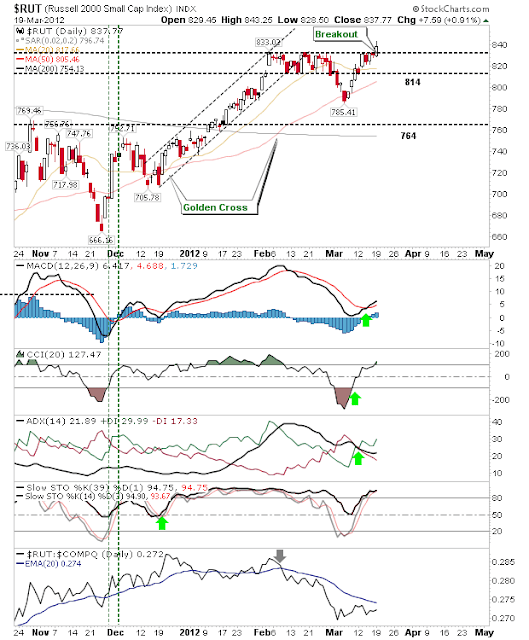
It was a generally quiet day for the markets with indices adding less than a 1% on light volume.  The only index to make an impression was the Russell 2000.  It finally broke to new highs, clearing February's congestion zone at 833. Technicals remain in good shape. Next on the to-do list is the semiconductor index; can it clear 440? And lend its weight to the Nasdaq rally? The rally gathers momentum. Can the Russell 2000 build on today's breakout? Can strength in the Nasdaq generate a breakout in the semiconductor index? If there is a bearish turn then shorts will be most active in these indices as these have underperformed to date. ---- Follow Me on Twitter Dr. Declan Fallon is the Senior Market Technician and Community Director for Zignals.com . I offer a range of stock trading strategies for global markets which can be Previewed for Free with delayed trade signals. You can also view the top-10 best trading strategies for the US, UK, Europe and Rest

Weekly Market Commentary: Rally Makes New Highs

Image
Markets posted new highs within rising price channels, led by a breakouts in the Dow and S&P, as breadth indicators continued to map swing lows. Volume rose in accumulation as money flowed in from the sidelines. The S&P cleared the 2011 swing high, but has larger resistance at 1,426 from 2008 to contend with. But given the breaks in other indices this should be cleared over the coming weeks. The Percentage of S&P Stocks above the 50-day MA rose sharply after spiking at a low in the 50s, but is off past swing highs in the 90s. The one concern is the 'sell' trigger in the MACD which may suggest the top in the S&P is closer than expected. The S&P Bullish Percents slow burn a swing high, but this is not necessarily bearish for the S&P; in 2009 the S&P added another 10% after the breadth indicator topped at 88%. The Dow was able to take the Large Cap rally a stage further. It cleared the 2008 high by Friday's close. The Nasdaq po

Daily Market Commentary: Markets Inch Higher

Image
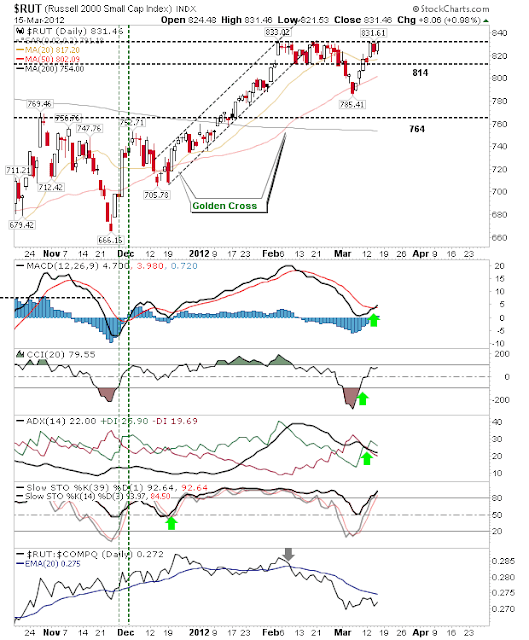
Markets managed to post a gain without negating resistance, but indices which had suffered most Wednesday were today's winners; namely the Russell 2000 and Semiconductor index. The Russell 2000 finished bang on resistance.  A nice 2-day price handle is in place, helped by an upticking 20-day MA which can be used for trailing stops.  The MACD completed the bullish picture with a new 'buy' trigger. The Semiconductor index also got the benefit of a buyer's surge, so much so it has turned net bullish. Technically, it looks as if 438/440 will be breached - but one can't take anything for granted! The resurgence in the Semiconductor index should help the Nasdaq post new highs. Today's 0.5% gain on modest volume did enough to keep the headlines rolling, but it wasn't a particularly noteworthy day. The S&P keep chugging along, doing slightly better against the Nasdaq, but losing gradual ground against the Russell 2000 (which is overall bullish f

Daily Market Commentary: Holds Yesterday's Highs

Image
After yesterday's strong performance it was good to see the Nasdaq and S&P close near the highs of the previous day, although the Russell 2000 gave back a sizable chunk of its gain. The S&P saw a MACD trigger 'buy' with resistance still in play; another swing play opportunity? The Nasdaq is in a similar position to the S&P and not surprisingly, experienced a day very similar to its Large Caps neighbor - right down to its MACD trigger 'buy'. Unfortunately, the Russell 2000 gave back most of Tuesday's gain. If there is going to be any follow through lower it's going to be from this index. Bulls will look to the pending MACD trigger 'buy' which will help on its next pass of its 20-day MA. But the Nasdaq 100 is best placed for bulls. It was able to add to yesterday's gain plus it enjoyed a MACD trigger 'buy'. So, take your pick for Thursday; Russell 2000 for bears and Nasdaq 100 for bulls. --- Follow Me o

Daily Market Commentary: Funk Broken

Image
After a relatively insipid recovery from various bearish channel breaks it was a return to force for bulls. Indices posted gains close to 2% on significantly higher volume accumulation.  More importantly, it marked new highs for the November-March rally for the majority of indices. The S&P was a good example on the impact of today's buying.  Today's gain negated the channel breakdown (now redrawn as a rising wedge) with a clear break of 1,376 resistance, turned support.  If the wedge is to play as resistance then we should see a reversal from the open. The MACD remains on a 'sell' trigger, but this is likely to reverse tomorrow unless it's a very weak day. The Nasdaq is slightly more interesting because despite the move to new highs, it's still under the influence of resistance from its former rising channel. The volume gain was not as impressive as in the S&P, but it still ranks as accumulation.  Like the S&P it could see a MACD trigger '

Archive

Show more