Posts

Showing posts from November, 2017

Profit Taking Sweeps Tech While Large Caps Gain
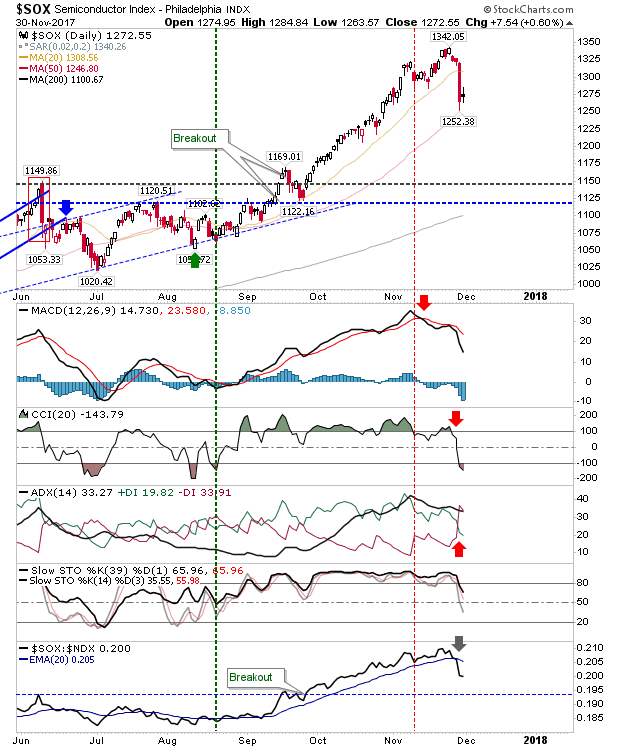
Image
There was a clear shift in market behaviour as Large Caps enjoyed the fruit of renewed buying as Tech indices (Semiconductors mostly) felt the heat of profit taking. After weeks of tight gains in the Semiconductor Index it was an easy turn for profit takers to come in and push the market down; in the absence of logical support it was going to be a hard task to pinpoint where potential depend may lurk outside of 1,150.  The 50-day MA may provide one such escape but there isn't a whole lot to suggest it may play as support.

Large Caps (Financials) Make The Jump Against Tech

Image
In the end, it wasn't Tech to surprise with an acceleration past its bullish rising channel but the S&P and Dow with fresh breakouts. A confluence of positive data  fueled the advance in Large Caps along with a dollop of short covering.  Tuesday's action ranks as a breakout in this indices and brings into play new support levels should profit-takers come in to take advantage of the gains.  The only downside for the S&P was the continued downtrend in relative performance against Small Caps - suggesting the real money is flowing into more speculative issues.

Nasdaq Tags Channel Resistance

Image
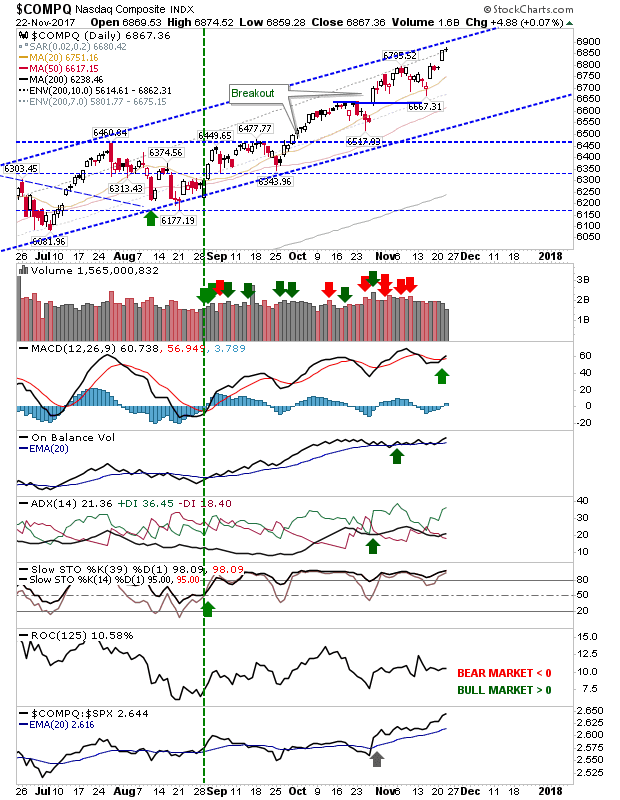
The post-Thanksgiving recovery offered some modest profit taking with Semiconductors experiencing the worst of the selling but the Nasdaq tagging resistance before reversing.  It offered the clearest 'sell'/profit take trigger after the August support 'buy' signal. Given action in other indices it could break above resistance, accelerating gains, but taking some profits here would be prudent.

Happy Thanksgiving :) Friday Should Be A Winner

Image
Thanksgiving Wednesday was never going to generate an exciting day but it was good to see early week gains retained. Upcoming Thanksgiving Friday is typically a day when Junior traders go wild and decent gains are posted - even if trading volume is light. With last week's lead action I wouldn't be surprised if this pattern was to repeat. Tech Indices have been leading the charge in recent days and I would look to the Nasdaq and Nasdaq 100 to be the primary chargers on Friday. Technicals are firmly in the green.

Russell 2000 and Semiconductor New Highs / S&P Breaks

Image
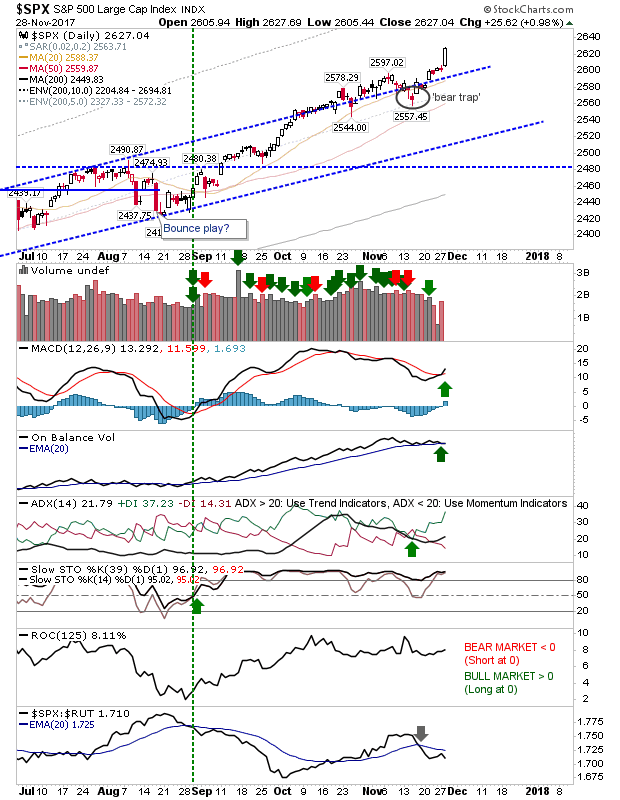
The S&P broke higher to confirm a 'bear trap' and also closed at a new all-time high. Volume climbed to register an accumulation day but there were further losses in relative performance and continued losses in the MACD.

Russell 2000 Clears Resistance

Image
The Russell 2000 followed through higher with a break of resistance and a bullish cross of mid-line stochastics. The 'bear trap' follow through is for new all-time highs. Watch for a MACD trigger 'buy' to support the 'bull flag' break.

Russell 2000 Makes It Back to 'Bull Flag' Resistance Leaving 'Bear Trap' Behind

Image
Over the course of Thursday and Friday the Russell 2000 reversed what had looked like a runaway breakdown into a counter rally and potential breakout. Now it's the time for shorts, FOMO longs and existing longs to pressure resistance. Action over the last two days of the week was particularly tasty particularly if you are looking for an extension of the August-October rally. Better still, there isn't a whole lot of competition from other indices for trading opportunities. Long risk measured from a stop below 1,454.

S&P 'Bull Trap' Becomes A 'Bear Trap'

Image
As this rally has often done, just as you expect a reversal to start, bulls come in (hard) to bid up the market. The S&P had the clearest switch as it moved from a 'bull trap' to a 'bear trap'. If it can post a break of 2,597 it will have little to stop it; in such a scenario watch for a fresh MACD 'buy' which would confirm recent losses as a pullback 'buy' opportunity. Stops on a loss of 2,557.

Bears Turn The Screw

Image
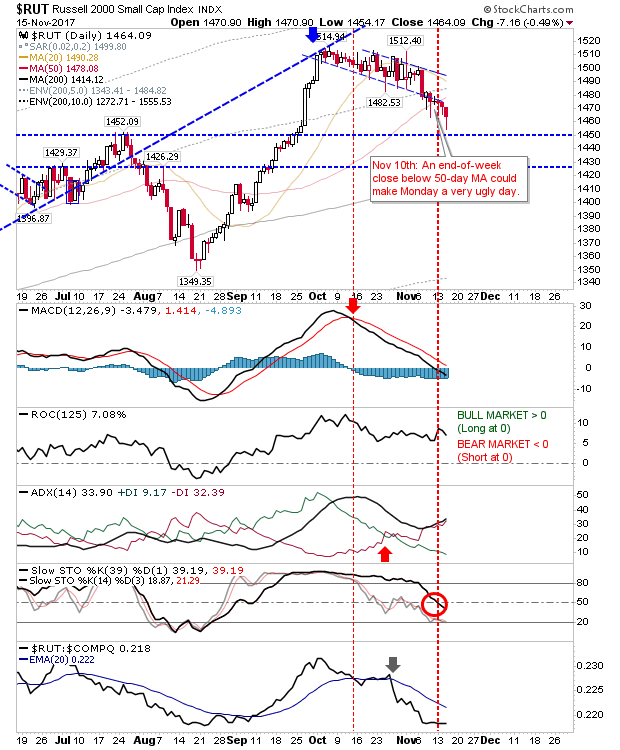
The Russell 2000 was again under pressure as it shed another 0.5%. The Russell 2000 now trades below its 50-day MA despite recovering some of today's intraday losses. It looks like controlled selling with an artificial prop to prevent a rout. The 200-day MA is the next port of call but a 1% loss of more will bring sellers in fast. Technicals are weak but not oversold.

Bulls Able To Recover Early Losses

Image
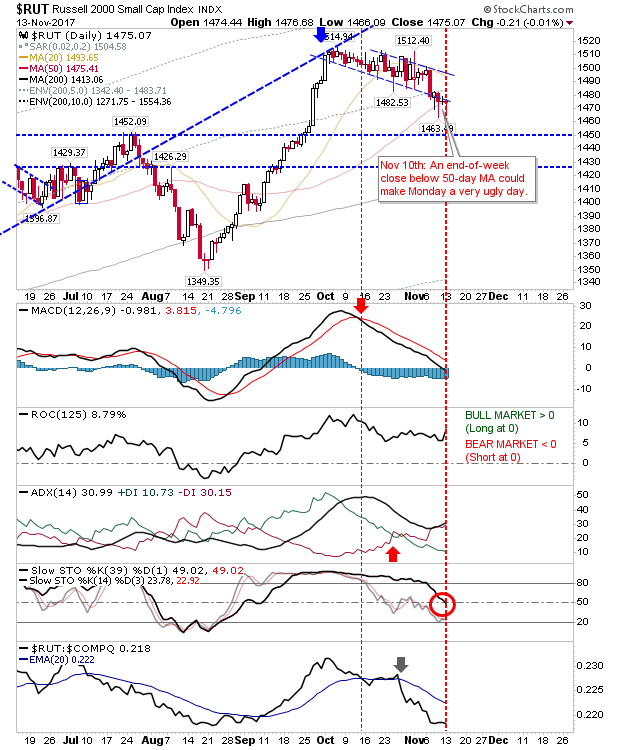
Another day where bulls had to dig deep to make back early losses but there was little more beyond that. The Russell 2000 remains the index most feeling the pressure. It's trading below the 50-day MA but hasn't experienced the kind of day where longs will feel pressured to sell. Some traders may take an aggressive long with stops below 1,463 with the index hugging support of the (failing) 'bull flag' - although it doesn't look a particularly attractive trade. Technicals are all net negative and relative performance is very poor (for Small Caps).

Russell 2000 Turns Net Bearish Despite Intraday Recovery

Image
The index-to-watch for Monday was the Russell 2000 and while it didn't really excite it did suffer a net bearish turn in technicals. On the positive front, it held on to its 50-day MA for a third day in a row. There may still be enough for bulls to reverse the bearish technicals but there is little room for maneuver.

Russell 2000 Finishes Neutral; Tech Posts Minor Gains

Image
It wasn't a particularly exciting Friday but there were some points-of-action of interest. I had tweeted about the weakness in the Russell 2000 but there wasn't much satisfaction for either side. The Russell 2000 finished with a narrow doji at the 50-day MA. As it failed to close below the 50-day MA bulls will be satisfied with a successful defense of the 50-day MA but the narrow intraday range offers a bigger swing trade off a break of the high/lows from Friday. There is still a chance a break below the 50-day MA will kickstart an acceleration towards the 200-day MA and this still looks like the preferred outcome. Any move back inside the 'bull flag' will open up for a 'bear trap' and a likely break of 1,500 - a move above 1,480 will open up a long trade opportunity.

Russell 2000 Hangs On

Image
There were gains for all market but the Russell 2000 was able to dig in and come back after an early loss of 'bull flag' support. The Russell 2000 was able to rally back after testing its 50-day MA; those traders waiting for this will have benefitted from a handy risk:reward.

Russell 2000 Doesn't Take The Bait

Image
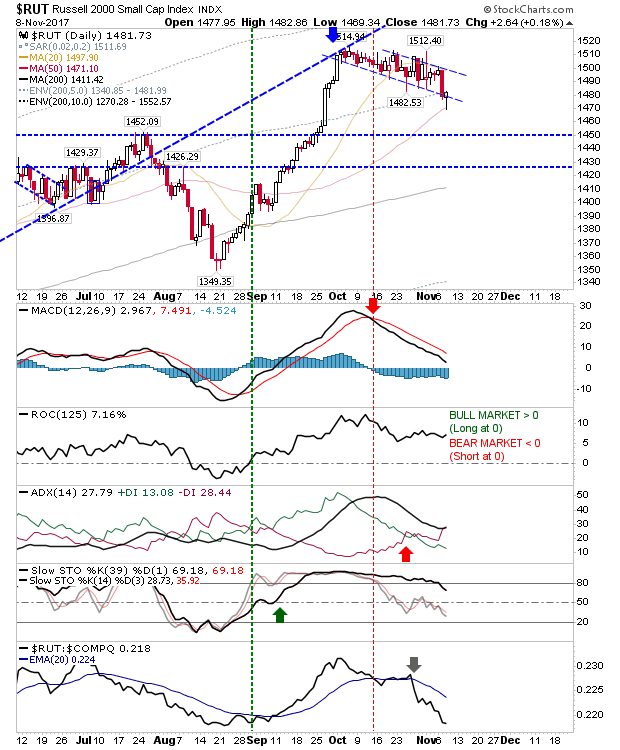
Some light selling across Large Caps and Tech indices meant there was little of interest for today/s action. The only action of note came in the Russell 2000. After inching towards 'bull flag' resistance the Russell 2000 took a leaf out of the sellers book and reversed back towards 'bull flag' support. It's looking vulnerable to a further profit taking which would threaten 'bull flag' support, although the fast approaching 50-day MA could step in to help.  Technicals are weak and weakening as relative performance swings away from Tech (strongly away) and Large Caps.  A failure at the 50-day MA would next open the 200-day MA; at the latter point I would expect Stochastics [39,1] to be oversold.

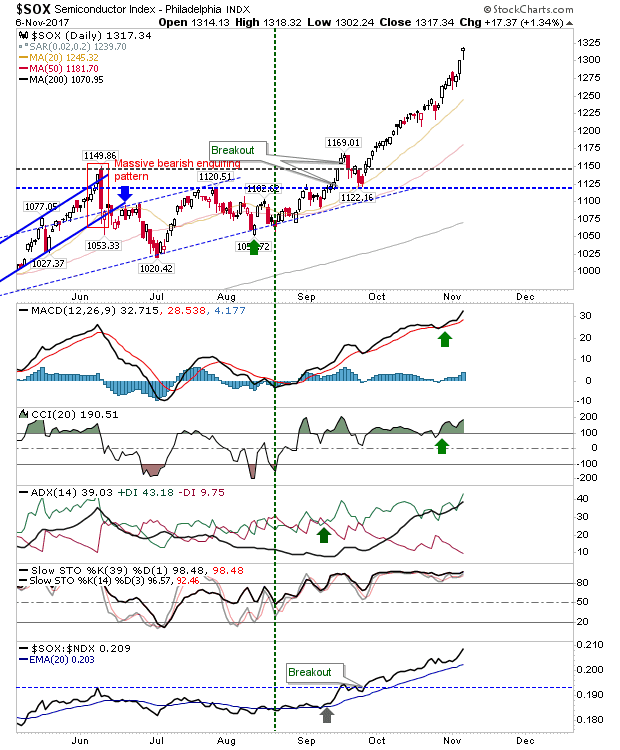
Semiconductor Index: Shooting Star? Russell 2000 to Breakout

Image
More gains for the market kept the rally intact which leaves little to add today. The only potential cloud on the horizon is the Semiconductor Index. Today finished with a gap higher with a bearish hammer which may become a bearish shooting star if there is a gap down and further losses by the close tomorrow. The rally from September lacks a pullback so some form of sell off is anticipated

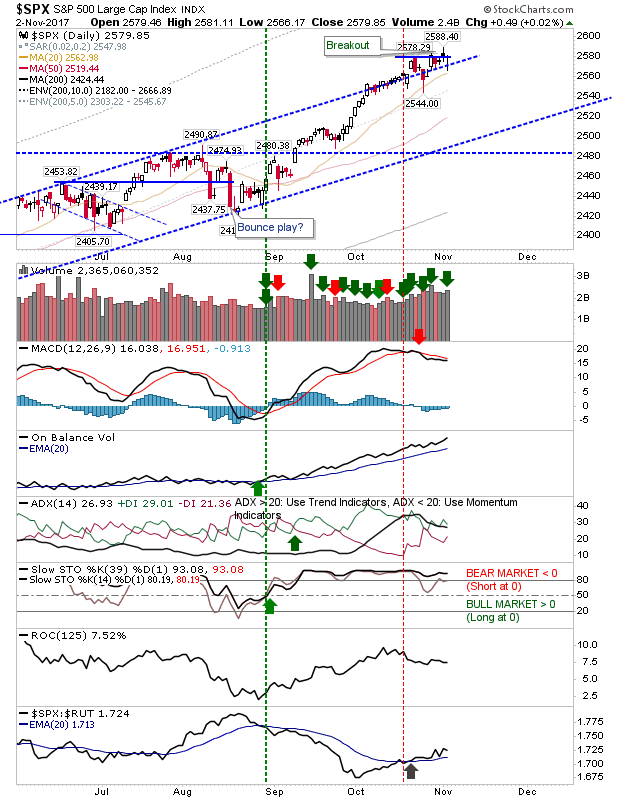
Nasdaq Market and Breadth Divergence

Image
Friday saw a nice little finish for markets with the Nasdaq, Nasdaq 100, Semiconductor Index and S&P all doing well as strong earnings from multinationals keep the rally chugging along.  The only index to remain on the outside was the Russell 2000 as it continued to map its 'bull flag'. The S&P reaffirmed its breakout after looking like it had topped out.  Keep an eye on the MACD as it sits on the verge of a new 'buy' trigger well above its bullish zero line; On-Balance-Volume is also performing strongly. A pop like it enjoyed in late September would not be surprising.

Markets Stabilise

Image
Early morning selling was reversed by the close to leave markets in a stable position and their rallies intact.  For the S&P, the risk of a 'bull trap' was negated with a return to support on higher volume accumulation.  The recovery wasn't enough to reverse the MACD trigger 'sell' but any upside tomorrow would probably be enough to trigger a new 'buy' signal in this indicator.

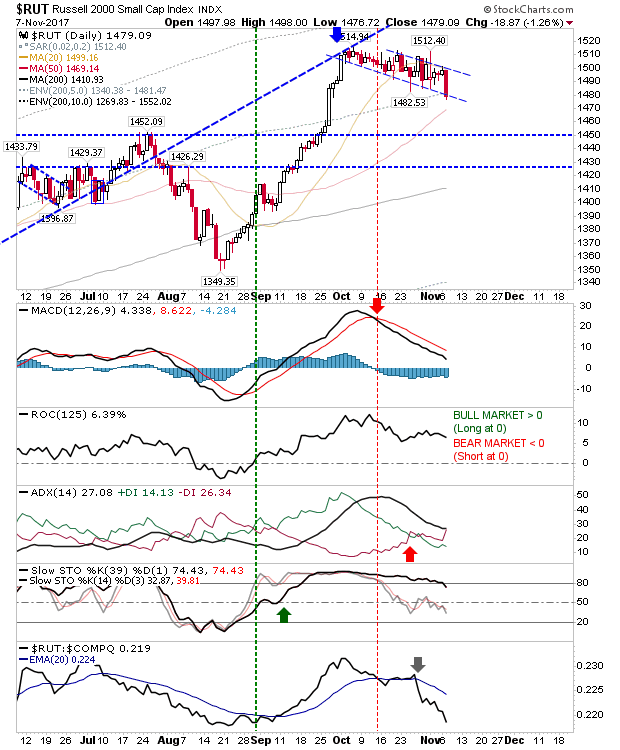
Russell 2000 continues to be a Rollercoaster

Image
Sellers made a return but it wasn't anything too damaging. The Russell 2000 had attempted a 'bull flag' breakout but was rebuffed to fall back inside the consolidation and close to yesterday's lows. This still looks to be mapping a consolidation and it may need a test of the 50-day MA to drive a fresh rally.  The only concern is the rapid loss in relative performance but everything else looks okay.

Archive

Show more