Posts

Showing posts from February, 2021

Selling Intensifies

Image
Looks like Gamestock Part II has put a scare in the market!  While this stock starts another wild ride, the broader market took a step back. Today's move carries more weight because it marked the first wide intraday day in a while, and was the first real day of selling experienced since September. For the Nasdaq, this amounted to a support break and a close below its 50-day MA. Volume selling was lighter, but perhaps shareholders aren't as worried as they probably should be...

Sellers hit Nasdaq and S&P 50-day MAs

Image
Perhaps a degree of complacency has crept into the market? Today's selling brought the Nasdaq and S&P back to successful tests of their 50-day MAs. What was concerning was the general lack of volume on what is typically an important support test for the indices.  Both the S&P and Nasdaq were able to stage successful intraday recoveries, but again, volume should have been more to support it.  What we need to watch for tomorrow are losses - typically from the open - that push down into today's spike low for the aforementioned indices. Particularly if this selling volume picks up relative to today.  I would think any close below today's finish would indicate that today's lows (or the 50-day MAs.) will act as support for long.  The Nasdaq probably did enough to defend trend support, although technically there was a big uptick in ADX, and the bearish MACD accelerated downwards. 

Russell 2000 ends the week on a high

Image
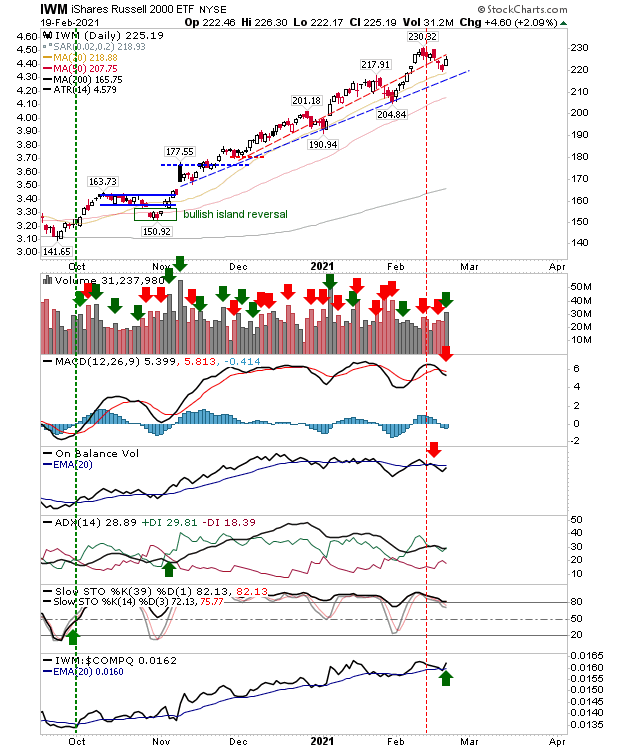
After drifting towards a period of under performance relative to the S&P and Nasdaq, the Russell 2000 was finally able to post same gains to at least stall the weakening momentum. The Russell 2000 was able to make its stand at its 20-day MA on higher volume accumulation. However, it still has 'sell' triggers in the MACD and On-Balance-Volume.

Low volume selling finds support

Image
A third day of selling for indices saw some preliminary support get tested.  In the case of the Nasdaq it was converged support established from the January swing high and its 20-day MA.  It did come on the back of a MACD trigger 'sell', but other technicals are in good shape. Plus, there is a new relative performance 'buy' signal relative to the Russell 2000.  There may be a short term 'buy' available given the relatively light selling volume which took it there.

Light Selling

Image
We are not seeing a whole lot from either side of the market, just a mixed sequence of low key buying and selling which so far has edged in bulls favor, but there would be no give aways on the daily reporting - only by looking at the weekly charts would you see the benefits of this action. For the Nasdaq we are seeing is a general drop in trading volume after a steady build up since early November. Whether this is a sign of things to come remains to be seen. The index is slowly building towards a period of potential relative outperformance, which should help it attract buyers. Other technicals are net bullish with On-Balance-Volume going particularly well despite the recent drop in trading volume. 

Buyers consume selling pressure

Image
Just as sellers were trying to exert some control in the market, along come buyers to soak up the supply and then add to demand. There wasn't a whole lot of buying volume on Friday, but there was enough to at least leave indices near weekly highs.  The Nasdaq didn't close at a new all-time high, but it did enough to pressure the early week high with technicals all net bullish. The relative loss against the Russell 2000 is slowing, but it hasn't yet generated a trigger which would mark relative outperformance

Sellers Make A Return

Image
No surprise to see sellers make an appearance after a sequence of gains. It was fairly measured selling without any real panic and the percentage loss was light. Buyers were able to make back some of the losses by the close of business. The first test for the indices will be the January swing high.  Both the Nasdaq and S&P are underperforming the Russell 2000, so there was a risk selling could have been more emphatic for these indices, but this was not the case. 

Indices Repeat Friday's Action - Russell 2000 leads

Image
Monday registered further gains, but buying volume was light. The biggest gain was the Russell 2000 as it added 2.65% on an acceleration of the gains. This was enough to return a new 'buy' signal in the MACD, returning technicals as net bullish.

Friday's Market Doji Point To Indecision

Image
We closed the week with small doji at the top of recovery rallies for the Nasdaq, S&P and Russell 2000.  This candlestick is typically neutral, but given what's come before I would view these candlesticks with a more bearish bent. The S&P has returned to a net bullish stance in supporting technicals, although relative performance against the Russell 2000 actually ticked away from a possible new 'buy' signal.  While Large Caps are still lagging Small Caps they still have the benefit of a new all-time high to work off.  Buying volume across last week was light; this will need to pick up if all-time highs are to be maintained. What should work in its favour is the 'bear trap'; this will have pushed some traders on to the wrong side of the trade, forcing them to cover (or go long again) if they haven't already. 

Russell 2000 and Nasdaq at new highs

Image
The Nasdaq and Russell 2000 both enjoyed pushes to new all-time highs, albeit on relatively light volume. Despite the gain, the Nasdaq lost relative ground against the Russell 2000 but the gain keeps the November trend running.  Technicals returned to net bullish. 

Bulls are trying to stage a recovery

Image
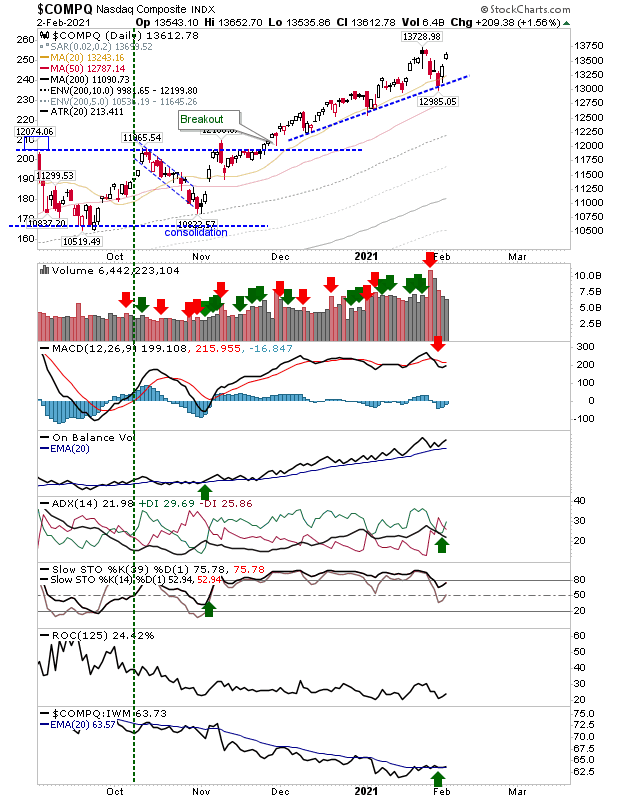
There is still work to be done but indices are trying to make back lost ground from last week. If there is a concern it's that buying volume wasn't great. We will start with the Nasdaq; Friday's selling drove price action into the rising trendline, while Monday delivered a recovery. The swing high from January hasn't yet been challenged. Only the MACD is on a 'sell' trigger and it will take more than a couple of days of buying to bring this back into net bullish territory. 

Archive

Show more