Posts

Showing posts from June, 2012

Quick Update: Bulls Need This Rally To Work

Image
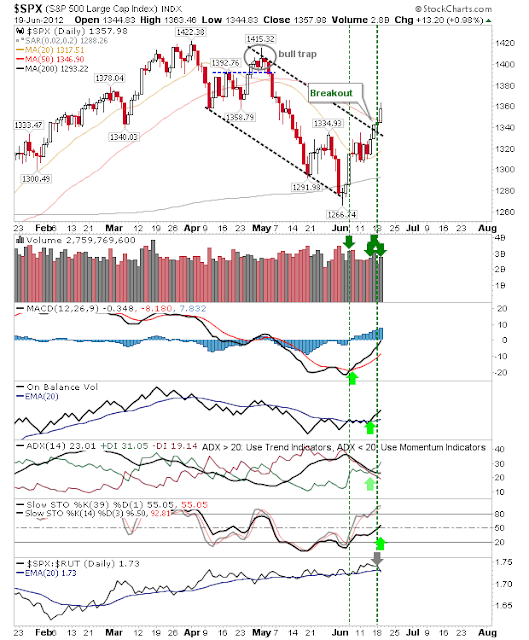
It's an important time for bulls to work their magic.  Markets are still vulnerable and Blain over at StocktradingToGo  has a chart for the S&P which neatly shows the challenges bulls have to overcome if something more dramatic to the downside isn't going to emerge. I have repeated the key elements here. In effect, for the S&P, bulls have to hold rising channel support and comfortably clear 1,360 if it's going to offer sideline money the confidence to step in and buy.  Today has offered a good start, but there is still more to do. Have a great weekend! --- Follow Me on Twitter Dr. Declan Fallon is the Senior Market Technician and Community Director for Zignals.com . I offer a range of stock trading strategies for global markets which can be Previewed for Free with delayed trade signals. You can also view the top-10 best trading strategies for the US, UK, Europe and Rest-of-the-World in the Trading Strategy Marketplace Leaderboard. The Leaderboard

"Gone Fishing" until Weekend

Travelling on business so out-of-action until the weekend.

Daily Market Commentary: Consolidation

Image
After recent gains it was inevitable there would be a rest day. Today was a perfect consolidation with a close  near yesterday's highs and lower volume selling.  Technicals continued to improve. The Nasdaq turned net bullish as action was concentrated above the 50-day MA.  The narrow intraday range offers a swing trade opportunity on break of day's high/lows. It was the same story for the Russell 2000. The S&P continues to lead technically and is the index best positioned to make further gains. As long as selling volume remains light it will keep the rally alive. --- Follow Me on Twitter Dr. Declan Fallon is the Senior Market Technician and Community Director for Zignals.com . I offer a range of stock trading strategies for global markets which can be Previewed for Free with delayed trade signals. You can also view the top-10 best trading strategies for the US, UK, Europe and Rest-of-the-World in the Trading Strategy Marketplace Leaderboard. Th

Daily Market Commentary: Early Follow Through?

Image
Today's buying came earlier than expected and helped solidify the bullish position. The S&P finished above its 50-day MA on higher volume accumulation with a net bullish turn in technicals; a solid day for the index and gives some breathing room when sellers make their inevitable return. But there was also another pass made with a relative strength shift to Small Caps and away from Large Caps - nascent though this shift is. This shift in relative strength was made apparent in the Russell 2000 after yesterday's disappointment.  Buyers pushed the index through its 50-day MA, leaving it close to a resistance challenge. The Nasdaq fell between the S&P and Russell 2000 with its modest 1% gain. It too was able to finish the day above its 50-day MA, but it was unable to finish the day with net bullish technicals. However it's well positioned to make additional gains. The only spanner in the works for the Nasdaq is the lagging semiconductor index.  In a mix

Daily Market Commentary: Breakouts Hold

Image
As Greek election results passed into history it was left to buyers to continue Friday's breakouts. Both Tech and Large Caps enjoyed a solid day with Tech perhaps edging the action on the day.  Buying volume was well below Friday's which marked Monday as a consolidation rather than a follow through. In addition to the channel break there was a bullish cross for the Directional Movement Index and On-Balance-Volume. Last week the Nasdaq 100 cleared channel resistance and posted a secondary breakout (the Nasdaq did likewise). There was also bullish crosses for On-Balance-Volume and Directional Movement Indicator. The S&P was more subdued on the day. It started the day closest to its 50-day MA and therefore best positioned to put itself into clear air, but by the close of business it remained contained by moving average resistance. The Russell 2000 continued to struggle despite finishing higher. More worrying, there is an increase in relative strength loss to t

Two Stocks Bucking the Selling: $AUXL and $CYBX

My latest Motley Fool post on Auxilium Pharmaceuticals ($AUXL) and Cyberonics ($CYBX) is available here Other stocks of interest covered in previous articles: $RAI, $TFM,   $P, $DSW, $PPC ,  $DRI, $GHDX ,  $GMRN, $ELRC, $MGRC ,  $MELI ,  $AKAM, $NTES ,  $GOLD, $PAAS ,  $ADP, $PAYX, $TXN ,  $CHK, $TSO ,  $POT, $FCX, $APL I own shares in $APL and $FCX.

June Trading Jobs

June's Trading jobs on offer: Trader Apprenticeship Experienced Traders Algorithmic Trader Trader, TIPS Junior Equity Trader - Technical Chart Pattern Trader Traders Support ADR Trader ($100-150K+bonnus) Manager, Active Trader Sales Securities Trader IV Experienced Options Trader Senior Equity Derivative Trader CEMEA Spot Trader Senior Mortgage Trader Multi-Disciplined Equity Trader Commodities Trader - Inside Sales Entry-Level Equities Trader Money Market Trader HY Corp Trader Fixed Income Derivative Trader Experienced FX Traders US Equity Finance Trader Subscribe to Trading Jobs by Email

Weekly Market Commentary: Buying in the Face of Greek Elections

Image
With Greek Elections too close to call it was surprising to see markets close on a high. Market breadth showed also demonstrated strong gains in support of the market. The Nasdaq Summation Index firmed up a swing low with stochastics deeply oversold and the MACD histogram climbing off a low. It was a similar story for the NYSE Summation Index The Bullish Percents were not so frothy, but there were still gains to be had.  The biggest strike against them is the neutral mid-position of stochastics. The Nasdaq finished the week at 2,872 which is close enough to the swing high from early 2011. Will this mark a right-hand-shoulder of a larger bearish pattern? Bulls hold the advantage and a higher weekly close (Friday) would negate this. The S&P also sits at an important juncture.  It closed on former channel support - turned resistance.  It has yet to challenge the early 2011 swing high, so channel resistance is the work-for-the-week. The Russell 2000 had a qu

Daily Market Commentary: Bulls Push for an Advantage

Image
It was a good day for bulls with a higher volume accumulation day logged. The buying favored Large Cap indices over Small Caps or Tech and it may be the job of the S&P to lead this rally out. The S&P is fast approaching channel resistance with 'buy' triggers for the MACD, On-Balance-Volume and Directional Movement Index. The swing low of 1,306 is a place for a stop. The Russell 2000 crept above the 200-day MA, but isn't close to breaking out of the consolidation in play since May. However, relative strength is attempting a second swing in favor of Small Caps over Tech. The Tech Index that had been doing the most running - at least for the first part of 2012 - has broken from its channel. Nasdaq 100 technicals have lost a little of their mojo but there is still a clear MACD 'buy' in place. For the past week it has been a sequence of up-down-up-down... A consecutive up day would do much to inspire sideline money to participate.  Traders will p

Daily Market Commentary: Coiling

Image
An afternoon sell off took the gloss on what had been a decent holding pattern for bulls.  The selling wasn't enough to undercut yesterday's low. This tightening of price action typically unwinds into a strong move; the direction of the move will be decided by the break of the high/low at the apex of the coil - which for now is Thursday's high/low. Selling volume was relatively light which further suggests a consolidation. The S&P is holding its 20-day MA with technicals improving. Buyers will want the May reaction high to break if they are to go long with confidence. The Nasdaq made another run to channel resistance before reversing; it too is holding its 20-day MA. While it does it offers bulls a long side opportunity with a stop on a break of the 20-day MA. The Russell 2000 is in the most trouble. The selling left it stuck below its 200-day MA and looking to the June swing low as next support. However, technicals continue to improve despite the selling.

Daily Market Commentary: Low Volume Recovery

Image
Yesterday's decline was undone by a fresh round of low volume buying. Large Caps were again the main beneficiaries but all indices posted gains. The Russell 2000 started the day below its 200-day MA but managed to do enough to close above this key long term moving average.  Today's low is a good place for a stop if looking at a longer term buy-play.  There was a resistance breakout in the MACD trigger line. The Nasdaq is setting itself up for a channel breakout with the MACD trigger 'buy' and a pending On-Balance-Volume 'buy'. The S&P managed to recover the most ground to Monday's losses.  The 20-day MA held as support with the next upside target the 50-day MA. For Wednesday, look to Large Caps to press their gains and drag Tech indices and Small Caps along for the ride. --- Follow Me on Twitter Dr. Declan Fallon is the Senior Market Technician and Community Director for Zignals.com . I offer a range of stock trading strategie

Daily Market Commentary: False Hope

Image
There weren't many prepared to drink the European Kool-Aid on an agreed Spanish bailout and bears found little resistance when they started to push.  One consolation for bulls was the relatively light volume to accompany the big intraday (bearish) swing - although technically it came in as a distribution day. Hardest hit of the indices was the Russell 2000. The selling went from the former neckline to below its 200-day MA - almost a 4% intraday swing.  Technicals are holding on to the bullish side although the index has struggled to outpace the Nasdaq. In contrast, the S&P lost just over a percent to leave the index on its 20-day MA. While the index closed at the day's low it didn't suffer the same intraday swing as the Russell 2000. Nasdaq selling was initiated at channel resistance, but closed with a bearish engulfing pattern. Bulls still have a MACD trigger 'buy' to work with in addition to improving On-Balance-Volume and Directional Movement Inde

Good vs Evil - Which Side will you Choose? $TFM $RAI

My latest Motley Fool post covers Reynolds America ($RAI) and The Fresh Market (TFM); you can read it here . Other stocks of interest covered in previous articles: $P, $DSW, $PPC , $DRI, $GHDX , $GMRN, $ELRC, $MGRC , $MELI , $AKAM, $NTES , $GOLD, $PAAS , $ADP, $PAYX, $TXN , $CHK, $TSO , $POT, $FCX, $APL I own shares in $APL and $FCX.

Daily Market Commentary: Early Burn Out

Image
It didn't take long for bulls to lose their mojo.  The morning gap wasn't sustainable and sellers were able to take the initiative with a secondary sell off into the close. The S&P closed just below yesterday's close but there was enough to see a MACD trigger 'buy' in support of the earlier On-Balance-Volume 'buy'.  Relative strength also attempted a swing back to Large Caps from Small Caps. With last Friday's selloff negated by yesterday's buying, how much of it will be negated tomorrow? The expectation will be for some downside, but today's selling was lighter than yesterday's buying so it may be a relatively minor loss to look forward too. The Nasdaq lost a little more ground than the S&P but it wasn't enough to negate the MACD trigger 'buy'. And it's close enough to the 20-day MA to suggest there is still support at this moving average. The Russell 2000 had an interesting day, cutting through 764 suppor

Daily Market Commentary: Friday's Losses Negated

Image
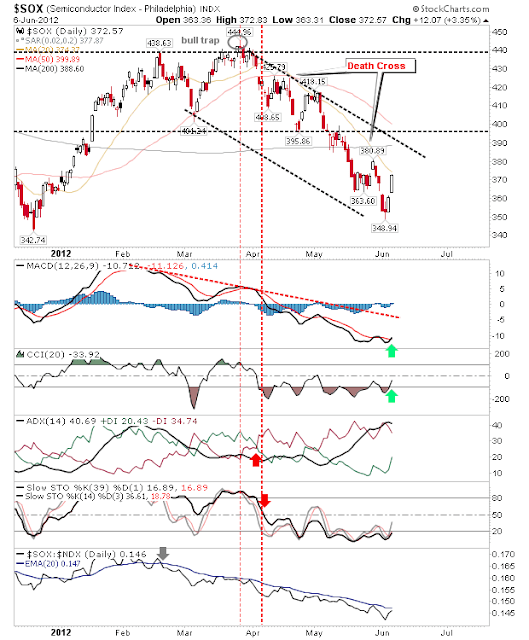
It was an odd day for bulls. All the key indices enjoyed big gains, posting returns of over 2%, but there was very little buying of speculative stocks with buyers preferring to focus on financials like Bank of America and Morgan Stanley. The biggest winner was the semiconductor index with its 3%+ gain. The index rallied right up to its 20-day MA and gained enough to see a MACD trigger 'buy'.  There was a gain in relative strength against the Nasdaq, but not enough to see a net bullish shift towards semiconductor stocks. Watch for a consolidation around the 20-day MA before a secondary push to channel resistance. The S&P also rallied to its 20-day MA with a bull cross in On-Balance-Volume, but not enough to see a bull cross in its MACD.  There was also a relative shift loss to Small Caps (Russell 2000), which in itself is bullish for the market as a whole, even if it hurts the S&P. The Russell 2000 had rallied back above its 200-day MA (and also to its 20-d

Daily Market Commentary: Disappointing Buying

Image
I suppose the non-news news in Europe was/is going to make it difficult for buyers to become enthusiastic. It's also a market which hasn't really extended its woes with the indices trading near their 200-day MAs. Perhaps if the indices were trading 15-20% below their 200-day MAs it would be an easier buy (?). Despite the overall limp buying in the markets the Russell 2000 managed a respectable +1% gain with a bullish engulfing pattern.  The bullish divergence in the CCI and MACD also suggest an opportunity for something more than a one day wonder. The semiconductor index also did well, finishing with a bullish morning star, but given the downward trend in relative strength to the Nasdaq 100 it might not be there just yet.  However, its time will be soon as it already qualified for a swing low under the >10% loss to the 200-day MA rule. The Nasdaq will be the index to benefit from any continued gain in the semiconductor index.  It also has a natural support area

Daily Market Commentary: Friday's Loss Stalled

Image
After Friday's whitewash there was a certain amount of relief to see the selloff stall with an afternoon comeback. The S&P held lower channel support but remained below its 200-day MA. There is a bounce play available with a stop on a loss of Monday's low, with upside targets of the 20-day MA and upper channel resistance. The Nasdaq recovered enough to peg to its 200-day MA with additional support around 2,750.  Lower channel support exists around 2,700, so even if today's narrow range is breached there will be another opportunity for buyers to defend. The Russell 2000 finished with a bullish hammer and a bullish divergence with the CCI and MACD histogram. Of the major indices it's the one most likely to offer the largest % return on the next bounce as relative strength (to the Nasdaq) trends higher despite its relative position to its 200-day MA (vs the Nasdaq). Bulls will look to buy a break of Monday's high with a stop on a loss of Monday'

Weekly Market Commentary: Percentage of Nasdaq Stocks above 50-day MA is Oversold

Image
Market Breadth offered a few swing low opportunities over the past few weeks but this is the first time supporting stochastics for the Percentage of Nasdaq stocks above the 50-day MA reached an oversold level.  However, other breadth indicators have shown greater resilience in their technicals. The Percentage of Nasdaq Stocks above the 50-day MA dropped into the high teens; the closest comparison was the swing low in 2010 but even in this scenario there is perhaps another couple weeks of losses before the absolute low is reached. The Nasdaq Bullish Percents is caught in the middle ground and has room to maneuver to the downside.  Supporting stochastics haven't breached the mid point (50%). Although the Nasdaq Summation Index joined the Percentage of Nasdaq Stocks above the 50-day MA in oversold technical territory. However, the breadth indicator hasn't quite reached its pivot low.  Typically, this  forms as an island reversal; if there is a gap down Monday we may ye

Archive

Show more