Posts

Showing posts from May, 2012

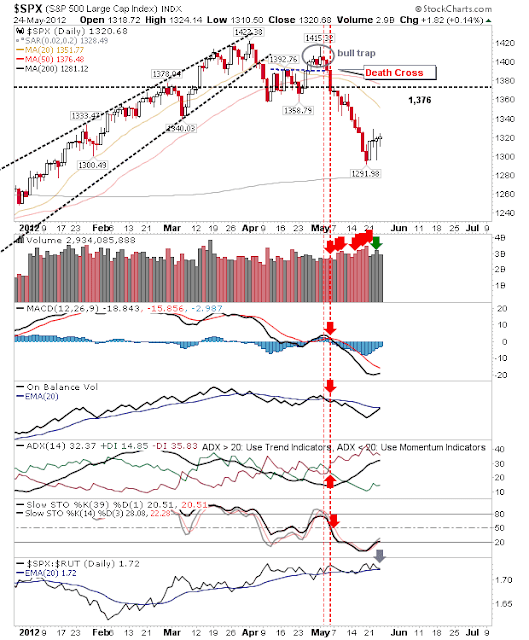
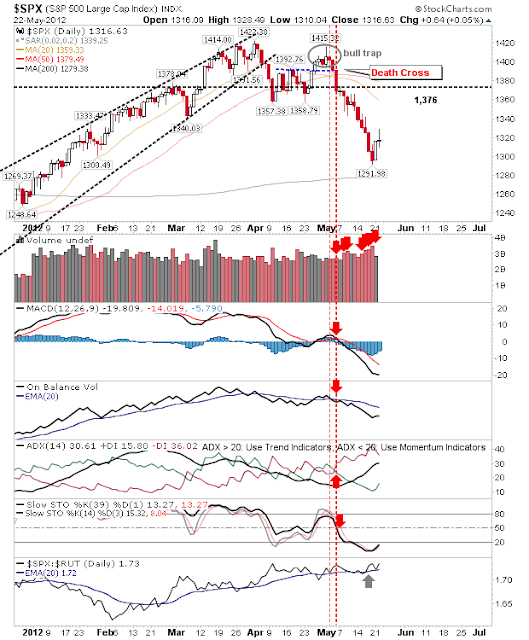
Daily Market Commentary: Small Caps Defend 200-Day MA
Image
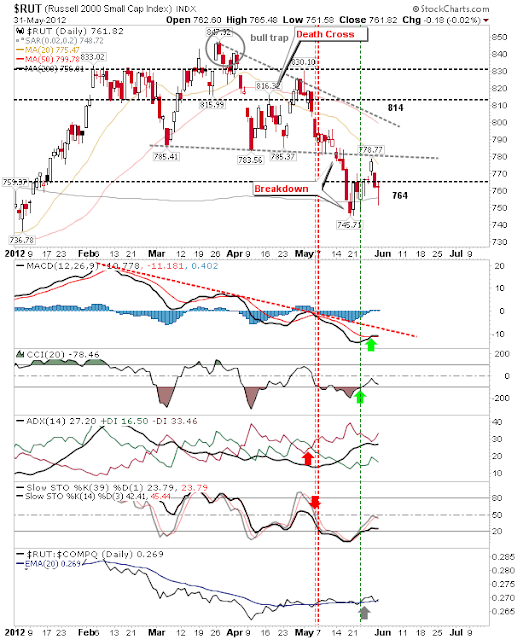
It was looking rough for the indices as Spain did its best to surpass Greece to be first in line to jump the Euro. Markets will need more than soothing words from the IMF to rescue this one but there was some reprieve in afternoon trading. The Russell 2000 was able to defend its 200-day MA as the 'buy' trigger in the MACD held on for another day along with the relative gain against the Nasdaq. A break above today's high sets up a long trade with a stop placed on the next duck below the 200-day MA. The S&P suffered another day of distribution but it finished in the middle of the days' range. The setup is not as bullish as it is for the Russell 2000, but Large Caps are holding a small edge over Small Caps which may make it a 'less' risky trade. The Nasdaq was able to finish near the day's highs, but it's caught between the Russell 2000 and S&P in terms of potential upside.  The MACD 'buy' trigger is still in play. Bulls nee

Three Stocks Enjoying Buying Pressure: $P, $DSW and $PPC

This week's fundamental stock analysis covers Pandora (P), DSW Inc (DSW) and Pilgrims Pride Corp (PPC) and is available here .  Previous articles include: Darden Restaurants and Genomic Health Garmin, Electro Rent and McGrath Rentcorp MercadoLibre Akamai and NetEase Randgold Resources and Pan American Silver Automatic Data Processing, Paychex and Texas Instruments Chesapeake Energy Corporation and Tesoro Petroleum Atlas Pipeline Partners, Potash Saskatche and Freeport McMoran

Daily Market Commentary: Lost Gains

Image
Poor housing data undid all the gains from yesterday and left the nascent rally vulnerable to further losses. The two consolations were losses were confined to the beginning of the day and didn't accelerate beyond the open, and selling volume was lighter than prior buying volume. Despite the losses, relative strength swung back towards Large Caps and away from Small Caps. Small Caps reversed hard without ever really challenging its 20-day MA (or former wedge support). While the Nasdaq was left in the middle of its channel, although it did do enough to see a MACD trigger 'buy'. The tight action - despite the loss - offers a swing trade opportunity buying/selling on a break of Wednesday's high/low with a stop on the flip side. ---- Follow Me on Twitter Dr. Declan Fallon is the Senior Market Technician and Community Director for Zignals.com . I offer a range of stock trading strategies for global markets which can be Previewed for Free with de

Daily Market Commentary: Approaching 20-day MA

Image
After a few days of tight trading the nascent rally took another step higher. Volume rose to register an accumulation day (albeit against a low volume bank holiday Friday), but it's all good if you are a bull. The one index which marked a technical improvement was the Russell 2000. Today saw a MACD trigger 'buy' as the index finished just below its 20-day MA and former support turned resistance. The S&P is a day's gain away from the 20-day MA but it has an additional few days of upside before it encounters resistance at the declining channel. It was the same story for the Nasdaq, although the 20-day MA is running close to falling channel resistance. In general, the indices (with the exception of the Russell 2000) are very close to seeing MACD trigger 'buy' signals. A MACD 'buy' combined with a cross above 20-day MAs could offer fresh upside follow through for the indices.  Given the proximity of indices to their 20-day MAs it's l

Weekly Market Commentary: Consolidation But Breakdowns Remain

Image
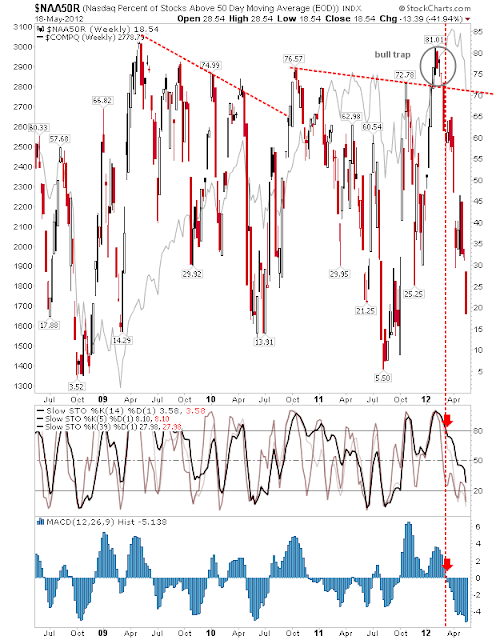
Markets finished the week higher, but were unable to reverse prior week's losses or trend breaks. The Dow is the index best positioned for bulls on Tuesday.  It trades on rising channel support although it has only recently fallen out of an overbought condition which suggests a play on holding channel support has a stronger chance of failure. Small Caps spent another week defending key support of 760, but the loss of the rising channel signals an end to the trend and a more probable start of a sideways consolidation - marked by 760 support. The Nasdaq is caught somewhere in the middle.  It had overshot 2,885 support but hasn't quite made it to its next support level.  Converged support around 2,700 is looking a more likely test. While Market breadth continued to push lower and into swing low territory.  However, stochastics for the Nasdaq Summation Index haven't yet reached oversold territory - suggesting further declines ahead for it (and the Nasdaq)

Daily Market Commentary: Sliding Along

Image
Bulls are having a hard time acquiring the momentum to confirm a swing low.  But at least the decline has been arrested.  Volume eased and remains well below the distribution of the previous week. The S&P is close to an on-balance-volume 'buy' with the MACD in pursuit. It was a similar picture for the Nasdaq, although former support may now play as resistance. But the Percentage of Nasdaq Stocks above the 50-day MA is firming up a swing low (and doing a better job than the index itself). Although the Semiconductor index is heading in the other direction. The Russell 2000 remains contained by 764 resistance despite yesterday's strong recovery.  But with the 200-day MA playing as support there may be enough to make it to the 20-day MA. Today's setup looks to favor bulls tomorrow and probably for the next few days. In addition, sectorbreadth is closer to oversold territory and in such situations the upside potential is good. ---- Follow

Stock Review: $DRI and $GHDX

My latest Motley Fool review on Darden Restaurants and Genomic Health is available here . Past Reviews: Electro Rent ($ELRC), Garmin ($GRMN), McGrath Rentcorp ($MGRC) MercadoLibre (MELI) Akami ($AKAM) and NetEase (NTES) Randgold ($GOLD) and Pan American Silver ($PAAS) Automatic Data Processing ($ADP), Paychex ($PAYX), and Texas Instruments ($TXN) Chesapeake Energy Corporation ($CHK) and Tesoro Petroleum ($TSO) Atlas Pipeline Partners ($APL),  Potash Saskatche ($POT) and Freeport McMoran ($FCX)

Daily Market Commentary: Consolidation

Image
Has the momentum been knocked out of the bounce already?  The losses were attributed to " weakness in Material and Energy " sectors, but these sectors were already on the ropes going into today. In my estimate, Materials are closer to a bottom than any other sector. The S&P closed flat after managing decent gains intraday, but trading volume was relatively light so it's a mixed bag as to whether the late day drop will be something to worry about.  Technicals aren't even indicating a bullish divergence and the 200-day MA wasn't tested. The Nasdaq closed slightly down on yesterday, but it hadn't achieved the same degree of intraday gains as the S&P so its loss wasn't as great.  Volume wasn't much different to yesterday. And like the S&P the technical picture is lacking the bullish divergence which might indicate a swing low. Of greater help to the Nasdaq are the more pronounced bullish divergences in Nasdaq breadth indices like th

Daiyl Market Commentary: Low Volume Rally

Image
After days of selling it had to happen bulls would get one day of joy.  The only problem was the lack of volume. A push to the 20-day MA would offer something for today's buyers as well as give shorts an angle to attack. The S&P didn't quite make it to its 200-day MA.  Neither did the Nasdaq Although the hardest hit indices enjoyed the best of the rebound Monday.  After crashing through its 200-day MA on Friday the Russell 2000 returned over 2% to take back its long term moving average. The semiconductor index also gained over 2%, but it hasn't yet reached a natural support level on which a strong rally can be based, but it may still have enough to see a test of the 200-day MA. Tomorrow will be interesting.  Given the lack of volume it's hard to see the momentum continuing, but an open gap up would not be surprising.  Of the indices, the Russell 2000 has an opportunity to work support off its 200-day MA. ---- Follow Me on Twitter Dr.

Weekly Market Commentary: Another Heavy Week of Selling

Image
Markets were left in an interesting position by Friday's close.  Ordinarily, I like to be a buyer when the S&P is at least 10% below its 200-day MA and sector breadth is in the position it's in, but I think there is enough here to have me jump in on Monday's open and add to my long term positions.   I suspect there will be a big one day gain to help establish the swing low. But I doubt it will be the absolute low for the current decline; at the same time, I don't want to be looking at a swing low with hindsight! Market Breadth is in swing low territory.  The Percentage of Nasdaq Stocks above 50-day MA dropped sharply to 18% although stochastics for this breadth indicator have not yet reached oversold territory.  Although the MACD histogram reached a new multi-year low - lower than the 2008 low. The Nasdaq Summation Index has some way to go before turning oversold based on stochastics, although the Index is close to a swing low based on past occurrences.

Daily Market Commentary: Further Distribution

Image
It was another day when early gains couldn't hold into the close of business. In further bad news, it was speculative Small Caps and Tech which took the brunt of the selling.  Having said, Large Caps couldn't hold on to their gains and closed at the day's lows. The S&P is been drawn to the 200-day MA as it fights its relative position against Small Caps; at the moment it looks to be winning (which is bad news for those looking for a new leg to the rally). The Nasdaq drifted away from declining support which suggests a possible acceleration in the decline. Likewise for the Russell 2000, which confirmed its break of wedge support. But the semiconductors suffered most with a substantial decline and break of the 200-day MA.  With the loss of the 200-day MA the next buying opportunity won't present itself until relative strength against the Nasdaq 100 swings back in its favour. Certainly there will have been many buyers forced out of their positions

Daily Market Commentary: Selling Continues

Image
It's just hard for buyers at the moment.  Given the 'Santa Rally' lasted into March it has become hard for sidelined money to commit and all too easy for holders of rally gains to sell. Volume climbed in confirmed distribution - a clear win for the sellers. Large Caps have been the most resilient, although it was interesting to see Small Caps trying to edge the relative strength battle (which if successful would be bullish for the broader market). The Nasdaq gave up on early promise to close near the lows of the day. Again, the index is hugging the declining support line, but the index is in need of a confidence boost. Small Caps attempted to regain support and create a 'bear trap'; but it wasn't able to do so - finishing the day below support. I suspect it will make another run at it tomorrow because the market looks like it wants to go higher. The indices which showed some activity were the Dow which broke support. And the Semiconductor i

Daily Market Commentary: Further Selling

Image
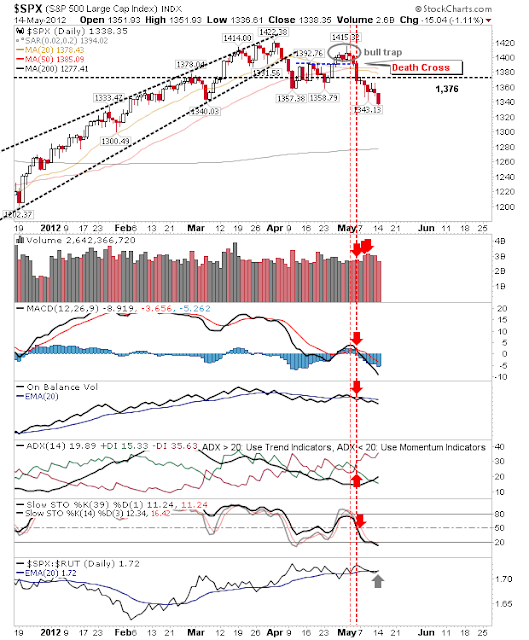
All markets experienced another round of selling as Europe dominates the headlines.  The selling wasn't particularly heavy, but it was damaging in taking indices away from support. The S&P is tempted by the siren call of the 200-day MA as technicals drift lower. However, relative strength continued to strengthen against the Russell 2000; so what money is flowing into the market is flowing into Large Caps. The Nasdaq is riding declining support lower, which is cold comfort if you are long.  Bullish divergence in MACD histogram offers an inkling a bounce will happen soon.  Like the S&P, looks ready to test its 200-day MA. The Russell 2000 broke support in a worrying shift after 4 days of holding.  The 200-day MA isn't far away and there is a good chance a 'bear trap' if tomorrow it can break above today's high. The only index left clinging to a trade-worthy support level is the semiconductor index.  Use a loss of the 200-day MA for stop placem

Three Dividend Stocks To Consider: $GRMN, $ELRC, $MGRC

Latest Motley Fool article covering Garmin, Electro Tent and McGrath Rentcorp is available here .

Weekly Market Commentary: Russell 2000 Support Test

Image
Markets finished the week scrambling for a bottom; some are in better shape than others but it may take further weakness in market breadth before that point is reached. The Percentage of Nasdaq Stocks above the 50-day MA finished the week at 32% but it had dropped into single digits last summer so a repeat can't be excluded -  although most major swing lows occur between 15 and 30% (so the index is not far off a trading low) The Nasdaq Bullish Percents still have a way to go before they reach strong bottom territory. While the Nasdaq Summation Index is still in breakdown mode after dropping out of its rising channel. The parent Nasdaq is close enough to a major support level to offer itself as a 'buy' point.  But there was also a MACD trigger 'sell' to balance against this. The Russell 2000 is the other index with the potential to be at a bottom. The index finished at converged support of the rising channel and the former neckline from early 20

Archive

Show more