Posts

Showing posts from December, 2016

Bull Trap for Nasdaq?

Image
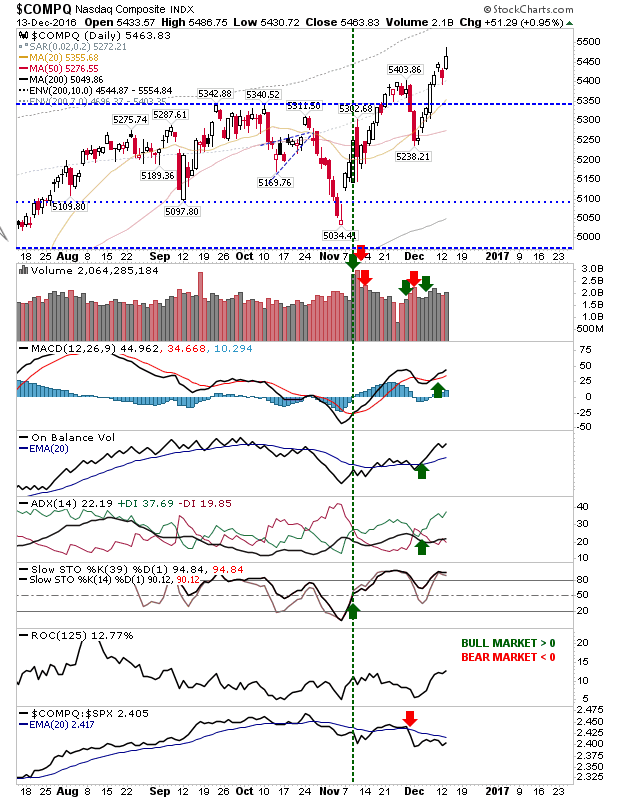
The initial upside breaks from the coils are faltering a little. The index showing the most vulnerability is the Nasdaq. There was some recovery before the close of business, but the damage has already been done. Technicals are still holding on the bullish side, with the exception of relative performance (against the S&P). Volume climbed to register distribution, but in holiday volume terms.

Bulls Lead Out of Coil

Image
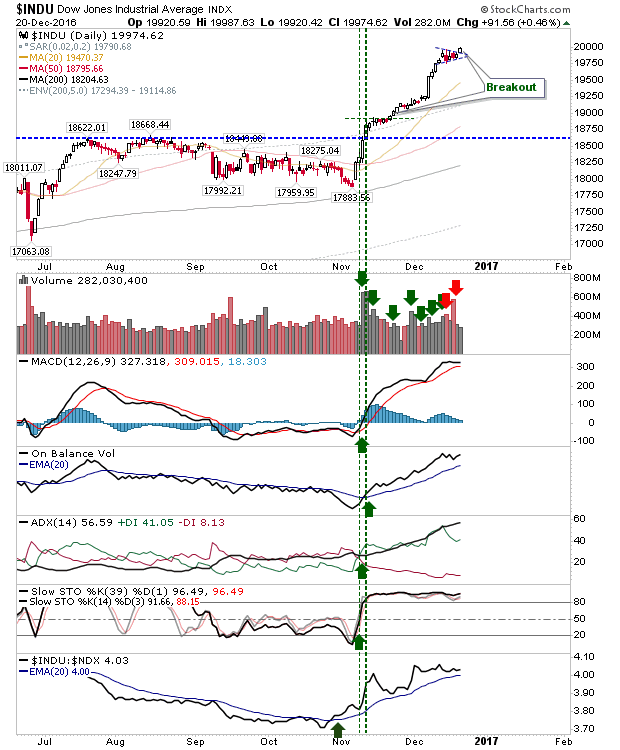
Action into today had looked to offer bears the advantage, but it was a morning gap higher from buyers which gave bulls the initiative. Beyond the opening gap there wasn't too much more buyers were able to achieve, with the exception of the Russell 2000, but today's gains would be enough to put bears/shorts on the defensive.  The lack of upside follow through may offer more aggressive shorts an opportunity. The Dow made a clean upside break of the consolidation.

The Perfect Coil

Image
The indices had another inside day (in a series of inside days) to set up a good swing trade play. With the emergence of spike highs it would suggest a break lower is the favoured move (along with indices performing relatively weak against their peers), but if shorts jump the gun and markers emerge from the coil higher then those shorts will be forced to cover - fueling fresh buying. The S&P is showing this coiling action best:

Distribution Friday

Image
This was the first day bears have been able to apply pressure since the election. It is now four days since markets pressured highs, and for the S&P, it was the third distribution day since the last accumulation day. While the S&P is drifting a little off course, it's still able to make relative performance gains against the Russell 2000. Money may start cycling from Small Caps to more defensive Large Cap stocks.

Fed Influences Dip Buying

Image
The Fed's announcement for faster rate hikes killed off my EURUSD trade and threw markets into a state of confusion. Traders had looked to regain their edge today, but late selling was enough to take some of the wind out of their sails. Having said that, it looked easier for profit takers to follow through on yesterday's Fed action than to scramble back in as buyers. The Russell 2000 had the best of the action, managing to retain the most of today' gains. There was a 'sell' trigger in the MACD, but given its relative position to the bullish zero line this looks to be a typical pullback action (which may not be done yet).

Buyers Jump the Gun - Nasdaq Soars

Image
Well, that selling didn't last long. The Nasdaq powered higher as leading tech companies like Apple and Microsoft added over 1%. While the index does well remains a long way from tagging the upper band marking a profit taking opportunity, as had occurred in the Russell 2000 this month.

Early Profit Taking

Image
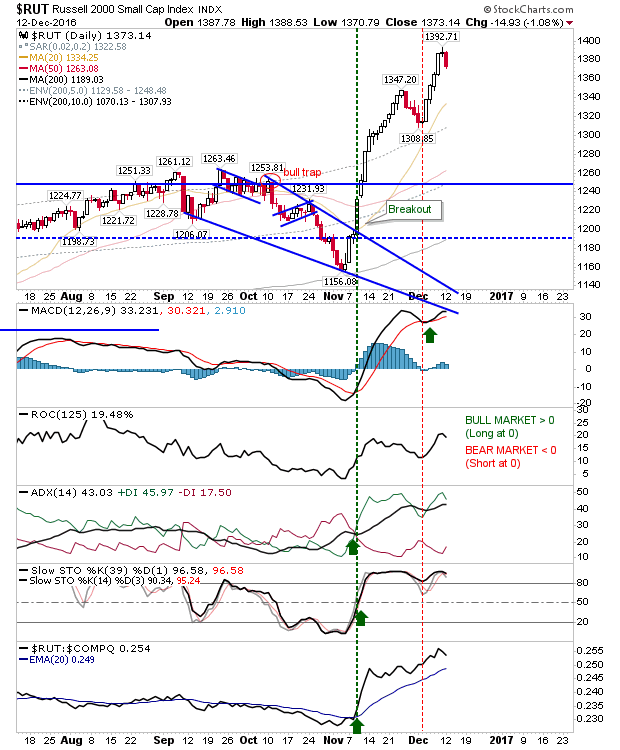
It was a slow start for some indices, but not surprisingly, the Russell 2000 saw the biggest of profit taking. The index lost just over 1% in a 'bearish evening star' candestick confirmation.   However, supporting technicals are little changed.

Russell 2000 Remains Rich, But Could Get Richer

Image
The Russell 2000 is getting close to tagging the 5% zone of historic highs relative to the 200-day MA. Selling covered calls would be prudent for holders of the ETF or Small Caps stocks, but since the election it has been all surprises. Premarket for the Nasdaq and S&P suggest the 5% zone could be tagged on Monday.  Technicals are so bullish that the zero mid-line for ROC has disappeared off the chart.

Large Caps Breakout

Image
Yesterday it was the action of Small Caps. Today it was the turn of Large Caps. Significant gains for both S&P and Dow took indices well past their recent swing highs. The S&P registered an accumulation day on a solid gain of 1.3%. Technicals are all bullish. Will this see a measured move higher? 2,310 is the target.

Reader's Question

Image
"... One thing though I would like you to shed light on: the price action we see nowadays: 1. Isn't it irrational exuberance 2. How does it compare to 2000 and 2007/08 and 3. In the wake of QEs to date and now promised fiscal stimulus, how large a bubble we will end up creating" Hi Solomon, Thanks for the feedback. [1] The March 2009 low was a 'generational' low for me (i.e. a buying opportunity like this is unlikely to occur again in my lifetime). I have to admit, it came a year early for me - but I think it's a significant low which will stand the test of time. [2] However, the broader market is in need of a significant pullback to mark a cyclical low; one much like in November 2011. The Russell 2000 was the only index to tag this in February 2016 and I think we are seeing the fruits of this now.  But all markets have to experience the sell off to definitively put a mark on this.  It has been 5 years since such a move last happened so we are (very) l

Russell 2000 in Take Profit Territory

Image
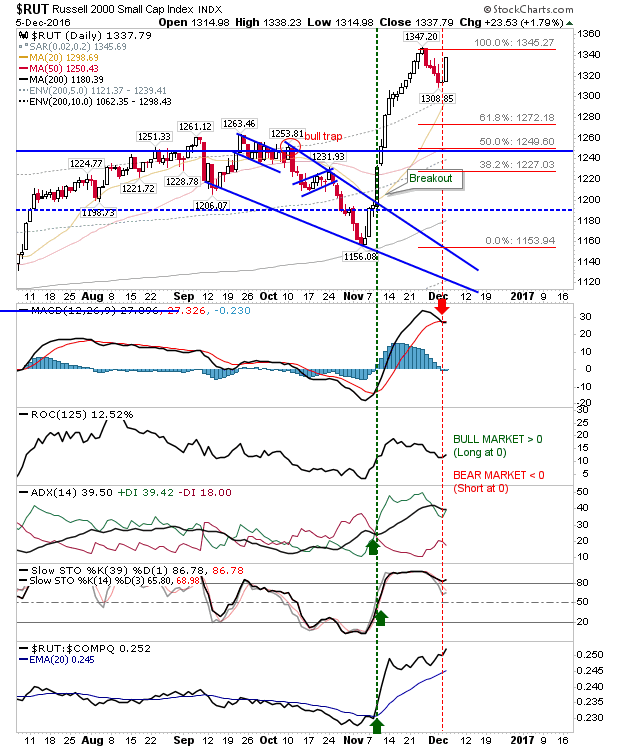
The Russell 2000 pushes again into the 10% zone of historic high prices (1,388 would be enough for the 5% zone last seen in February 2011). Back in 2011 the index rallied for another couple of months before it lost 30% from its high.  The next few weeks would be a good opportunity to take some money off the table to use on the next swing low.

Higher Volume Gaps Higher

Image
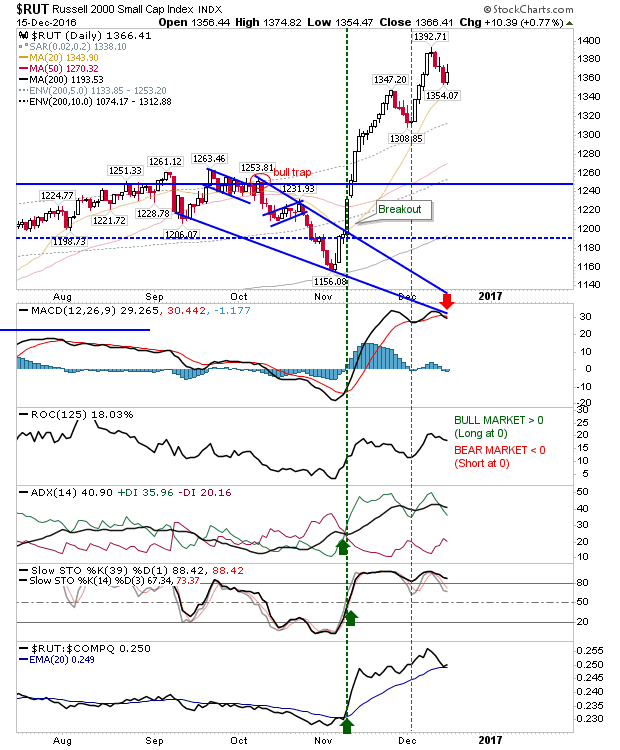
An interesting start to the week. Markets gapped higher off the open and were able to add some distance to their starting points. The Russell 2000 chalked up a near 2% gain as it makes a run on 1,347.  This was enough to finish the day at the high.  The MACD is still on a 'sell' trigger, but another day like today should be enough to reverse it.

Nasdaq 100 Net Bearish

Image
Friday's action was relatively uneventful with indices finishing near the day's lows, but none accelerating on Thursday's losses. The one change on the intermediate term time frame was the net bearish turn in technicals for the Nasdaq 100. The index remains range bound from August and has struggled as Semiconductors, Small Caps (and now Large Caps) have shone.

Semiconductors Hit Hard

Image
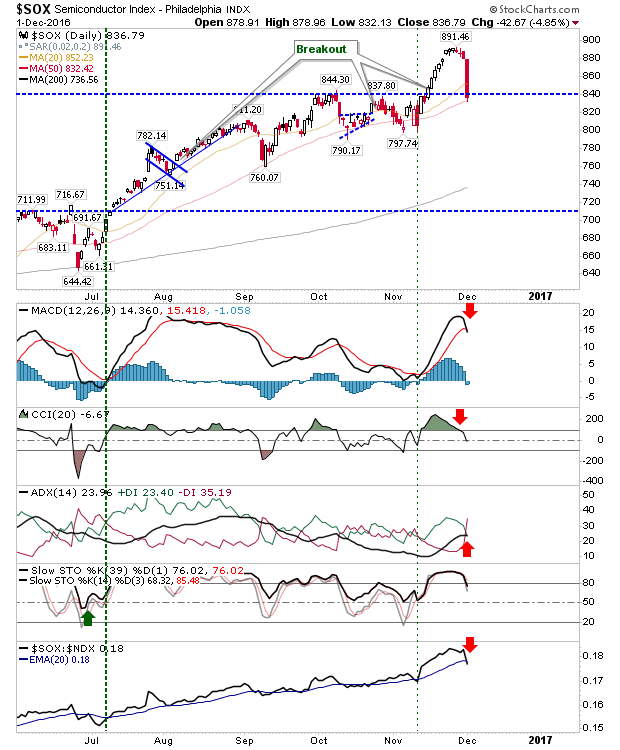
Internet troubles have limited me tonight, but the one chart I want to show is the near 5% loss in the Semiconductor Index.  Having escaped relatively unscathed from recent day's selling it was a whirlwind of action for the index today.

Archive

Show more