Posts

Showing posts from April, 2022

A last chance saloon for indices

Image
The Monday reversal wasn't enough to light a fire under bulls as sellers quickly returned to reverse all of that gain.  Indices are now left with just the lows of February to hang on too, but even that is under pressure for the Russell 2000. The Russell 2000 had looked like it was going to lead a recovery when it broke out of its base in March, but the resulting 'bull trap' did what most 'bull traps' do and reversed all the way back to the lows of the base and then break support. Technicals are net bearish but momentum is at least oversold - although price crashes occur from an oversold condition. Because we have a test of support there is a buying opportunity, but keep the stop tight. 

Buyers stop the rot but damage done

Image
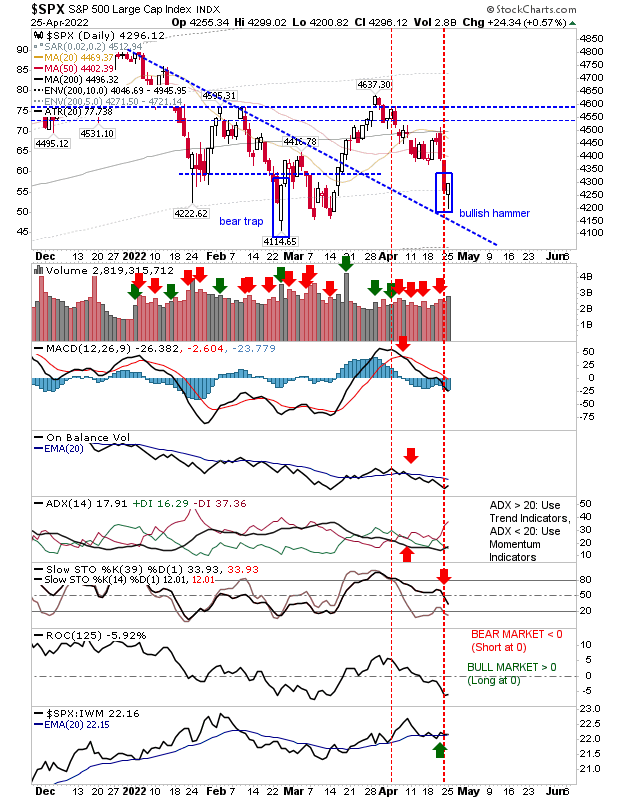
Today's recovery has offered the potential for a bottom and the end of the decline from March highs, but it leaves lead indices vulnerable to the undercut.  One day's buying does not necessarily equate to a reversal, but today's action will give aggressive buyers something to work with (using a loss of today's lows as a stop). Best of the action was the S&P as it ended with a bullish hammer, but reversal candlesticks need oversold momentum to strengthen their credentials and we don't have that here.

Sellers accelerate move back to February/March Lows

Image
A relatively torrid Thursday and Friday saw markets push towards the lows of February/March after failed attempts to shape a higher low.  Should we undercut these lows then we will have to consider the possibility for a larger measured move lower (anchored from the March high).  If were were to consider the Nasdaq as a starting point, then the measured move down would give an approximate target of 10,900 or the swing low of August 2020 (at 10,520). There isn't a whole lot on the technical side which is positive and the fact intermediate stochastics [39,1] are not oversold suggests there is more downside to come. 

Bears take the Easter Weekend Award

Image
Bulls tried to nip a win before the shortened week was out, but it was not to be. Wednesday's gains were reversed on Thursday's action, leaving markets to sweat out the long weekend.  The Russell 2000 held up the best of the indices, although the ETF ($IWM) finished with net distribution. On the plus side, the index is outperforming its peers - so if there is a leadership candidate for a rally, the Russell 2000 is the index to do the legwork.

Sellers keep the pressure on

Image
Today was another day for sellers to keep the pressure on the current decline.  The Russell 2000 ($IWM) was able to buck the trend by finishing the day higher but it did give back the majority of its gains by the close of business.  The Nasdaq and S&P have room to maneuver before hitting prior lows.  The Russell 2000 ($IWM) is outperforming peer indices but regaining momentum from a 'bull trap' is a concern. However, it's well placed to rally and any gain tomorrow would probably be enough to negate today's bearish looking candlestick. 

Minor losses pressure Thursday's reversal attempt

Image
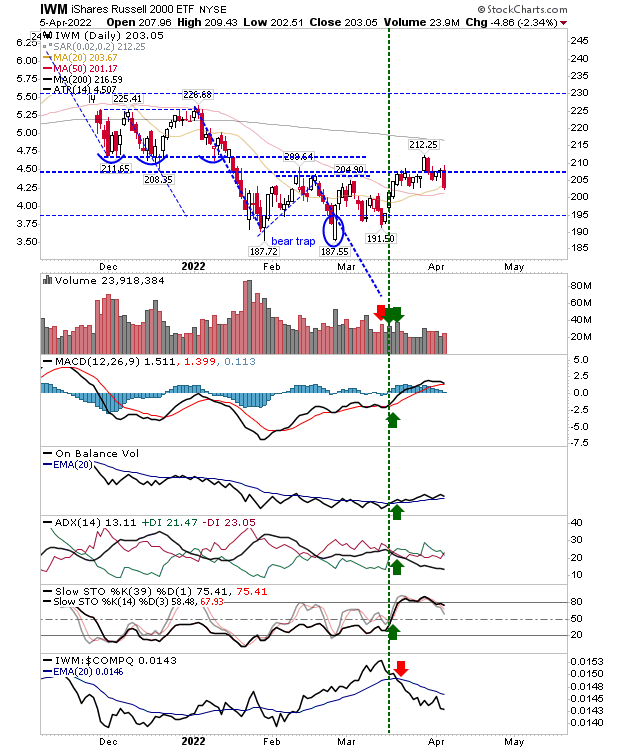
I was looking for more from Friday's trading action as sellers were able to prevent buyers from gaining any traction over the course of the day.  A soft open got softer as the day progressed and the week finished with markets now looking vulnerable to a gap down open on Monday.  If there was a positive it was that selling volume was light, but there was further technical degradation by the close. This was perhaps hardest felt in the Russell 2000 ($IWM), which sold off by less than 1%, but there was enough weakness to see a 'sell' trigger in stochastics to turn technicals net bearish for the index.  There is a support level around $192.85 which needs to hold if the index is to continue a sequence of higher highs - higher lows from the February bottom.

Markets attempt a swing low for the seven day decline

Image
It looks like we have completed a zig-zag retracement for indices, with the Nasdaq and Russell 2000 finishing the day with a second doji for the 'zag' to match the intial doji of the 'zig'.  There were additional support levels for indices to use too.  For the Nasdaq, today's 'dragonfly doji' also has the potential to form a bullish harami doji - building off the 20-day and 50-day MAs. There was a 'sell' trigger in relative performance against the Nasdaq, along with 'sell' triggers in the ADX and On-Balance-Volume. 

Mini-Correction in March Bounce

Image
It has taken a while, but we are finally seeing the correction in the rally which was started by the (surprising) rally following the February low test.  It looks like a buyers pullback, but there may yet be further losses before we see this move done.  The index most impacted by today's selling was the Russell 2000 as it lost its base-building breakout, and prices were returned into its earlier base.  Selling volume was relatively light (compared to January), but today's trading qualified as a distribution day.  Technicals remain net positive and it will now have the 50-day MA to lean on as support. 

Indices consolidate late week losses

Image
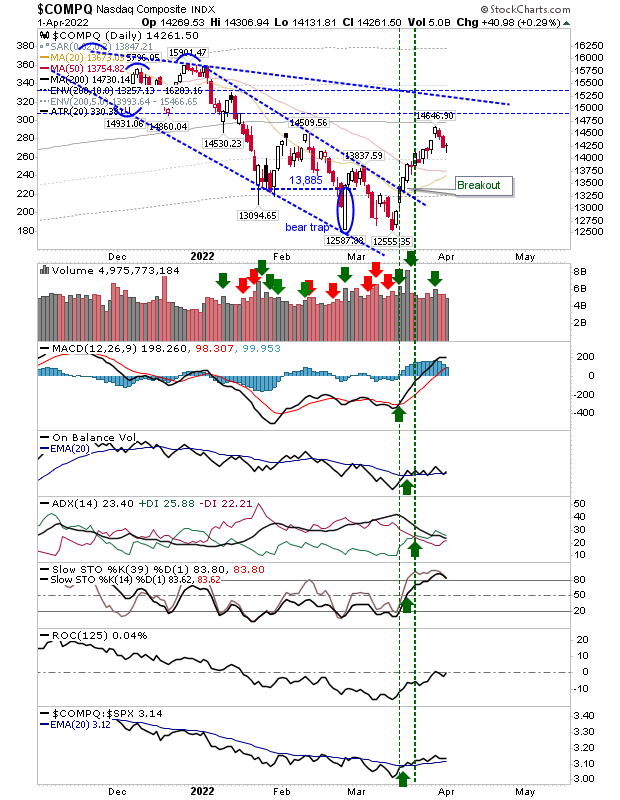
Last Wednesday and Thursday delivered the first real losses for this rally since it started around 3 weeks ago, but Friday but a nice 'full stop' to these losses - enough to offer buyers a relatively low risk:reward play for those seeking a trade. The Nasdaq finished with a doji, and potential bullish harami cross.  The latter is weakened by the lack of oversold momentum (stochastics) indicator.  However the Nasdaq is enjoying a relative outperformance over the S&P.

Archive

Show more