Posts

Showing posts from May, 2016

Pause in Advance

Image
With indices knocking on the door of new highs for 2016 it was of new surprise to see some profit taking. The S&P has struggled when it gets to 2,100, but each run at this resistance level weakens its importance as resistance. I have left the marker for the head-and-shoulder reversal, but a close above 2,111 will negate it.

Respectable Finish To Week

Image
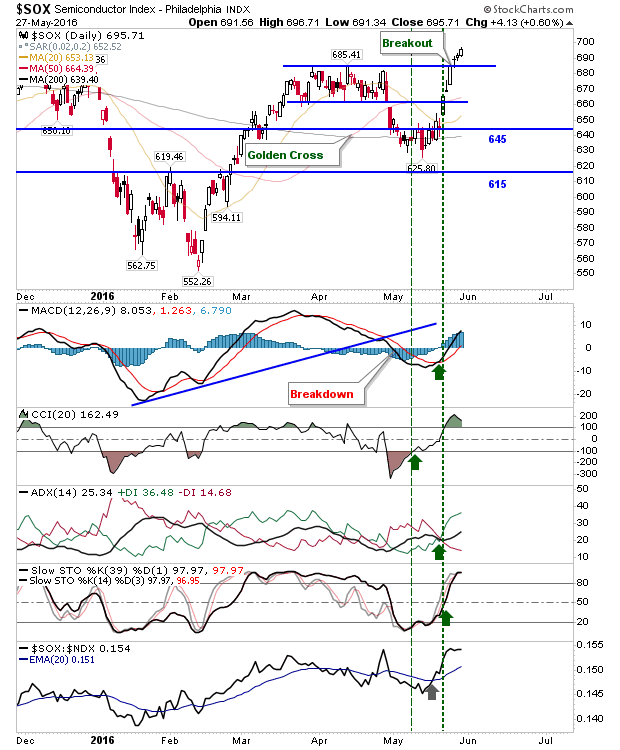
Semiconductors were the star of the week.  The index cleared Match/April congestion and posted six consecutive winning days in a row. Technicals are all in the green and the index is above all key moving averages. Weakness will be a buying opportunity; a test of the 50-day MA would be a good start.

Indices Net Positive Technically

Image
There wasn't much to say about to about today as Indices worked on consolidating the last couple days of gains. The real action came from supporting technicals, as they looked to mark a shift from a generally bearish technical picture to a net bullish one. The S&P got to resistance of what was looking a reversal head-and-shoulder pattern.  This pattern won't be negated until 2,111 is breached, but today's action is a step in the right direction.  The only negative is the continued relative under performance against Small Caps.

Semiconductors Pull Indices Along

Image
A big day for Semiconductor Indices has finally boosted other indices. Semiconductors finished above March/April highs on new near term highs in relative performance. It has been a big week for this index and this could set a positive tone for the rest of the summer.

Semiconductors Sucked Back By Broader Market

Image
Today was really a non-event. Friday's gains were great, but it was going to be hard to see more of the same today. This lack of action hit high flying Semiconductors after a positive gap open had made it look like another good day was in store. Other indices did very little. Semiconductors finished with a bearish 'inverse hammer'; some may look to the mid-line of stochastics [39,1] as a confirmation of this, but I suspect the index has done enough to return net bullish, which technicals - as of today - have confirmed. Time to buy pullbacks.

Friday Accumulation

Image
Indices finished the week strongly, pushing a follow through to Thursday's gain. Volume climbed to register an accumulation day. Indices still have to contend with moving averages as resistance, but get above these and there is room to run to all-time highs from last year. The S&P is back at converged 20-day and 50-day MAs which is also the neckline of the head-and-shoulder pattern. If bears are to retain control then the neckline has to hold as resistance, which means there is little room for additional gains. Relative performance has switched to under performance against Small Caps.

Late Rallies Recover Day's Losses

Image
It was a late morning reversal which clawed back losses from the open. Markets still finished with a close below the open, but it was looking ugly at the start of the day. The S&P  finished with a bullish 'hammer' just below the neckline. On the positive front, it may be rejecting the neckline breakdown I have talked about over the last couple of days. On the negative front, the failure to recover the neckline suggests bears maintain control.

Losses Outscore Gains

Image
Small gains fail to recover yesterday's losses. The trend is down, but losses are still modest - thanks to these regular gains.  The S&P is still clinging on to the neckline of the head-and-shoulder pattern. Volume climbed to register an accumulation day, but the 'spinning top' finish for the day leaves things in a more neutral state. A swing-trade using day's highs/lows as the trigger would be ideal, but an inside day would offer better risk:reward.

Bulls Recover Indices 50-day MAs

Image
Bulls were able to press their advantage with good relative gains. Buyers were able to recover 50-day MAs and take indices back from the brink. In addition to a close above the 50-day MA, the Dow did enough to generate a 'bear trap' - next up will be to break declining resistance from the high. Technicals edge in favour of bears and overall volume hasn't been great either, but because of such conditions, today's buying was harder to achieve.

Fresh losses with Russell 2000 under pressure

Image
The Russell 2000 experienced a third day of loses to push below the 50-day MA with technicals net bearish following the loss of stochastics [39,1] below the mid-line. Relative performance (against the Nasdaq) has also been in a downward trajectory since late April and is on the verge of a bear cross.

Bulls Post Late Stage Recovery

Image
It was looking bad for a while in early afternoon trading as bears looked to follow through on yesterday's losses.  Bulls did enough to finish the day in neutral territory, although the Semiconductor Index did not benefit from this late day rally. It was a particularly ugly day for the Semiconductor Index. A near 2% loss delivered an undercut of the 200-day MA. The sharp reversal in relative performance - in what was a new high in April - caught many bulls on the wrong side of the trade.

Two Bar Reversals

Image
After yesterday's gain it was disappointing to see such quick reversals. The Dow finished with the classic paired reversal. While this is bearish there are bullish factors to consider such as positive On-Balance-Volume, the 50-day MA, and stochastics above the bullish mid-line.

Mixed Bag

Image
There was a spread of action between bulls and bears, but no big change for any index. The Nasdaq and Russell 2000 had the best of the action, but it was little more than a half-hearted follow through of Friday's gain. The Nasdaq wasn't able to hold on to the highs of the day, closing in the middle of today's high/low range. Technicals are bearish, and trading volume was light.

Positive Friday on Light Volume

Image
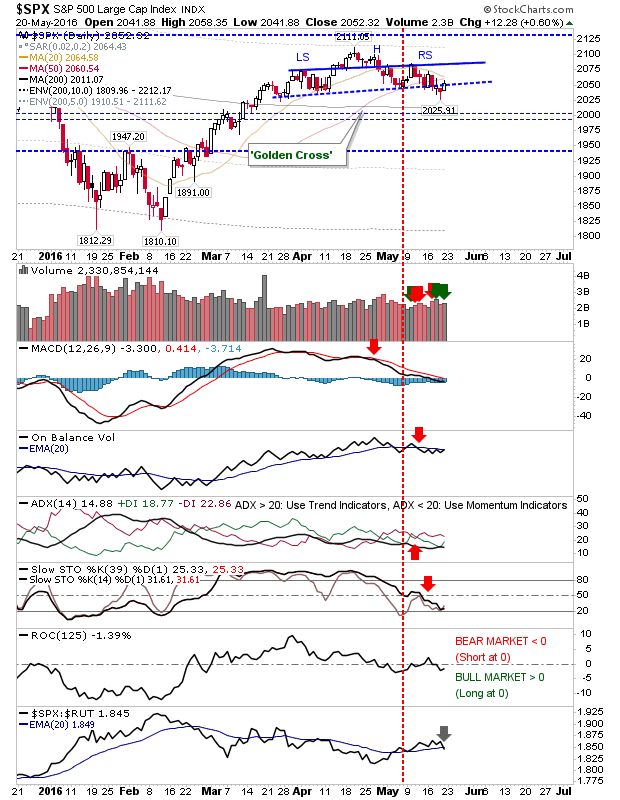
Friday delivered a positive end-of-week close after a sequence of down days. Volume was not impressive and was below mid-week selling. The S&P dug in at its 50-day MA, but is holding to 'sell' triggers in the MACD, On-Balance-Volume, and -DI/+DI. Relative performance finished the week with Large Cap strength overall Small Caps. Rate-of-Chart moved back to the bullish mid-line in what could offer itself as bullish buyback opportunity.

Low Volume Selling

Image
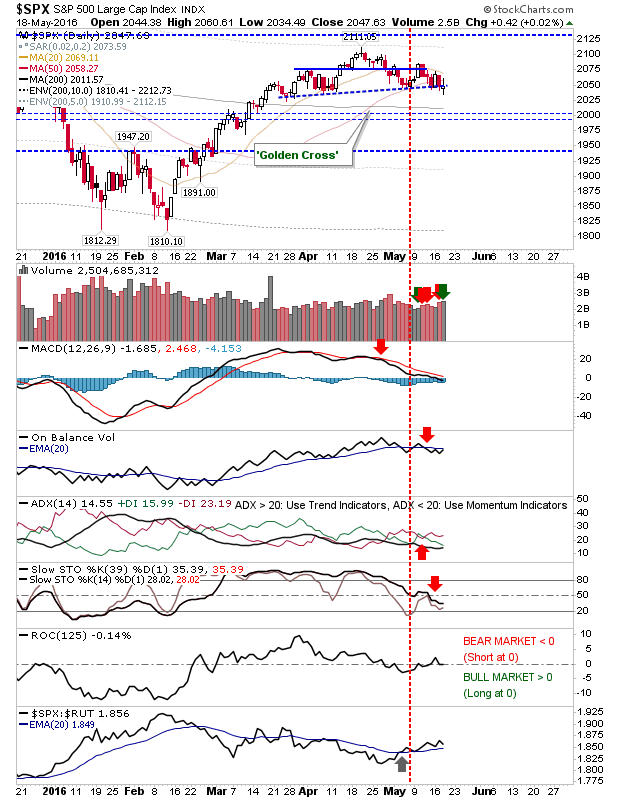
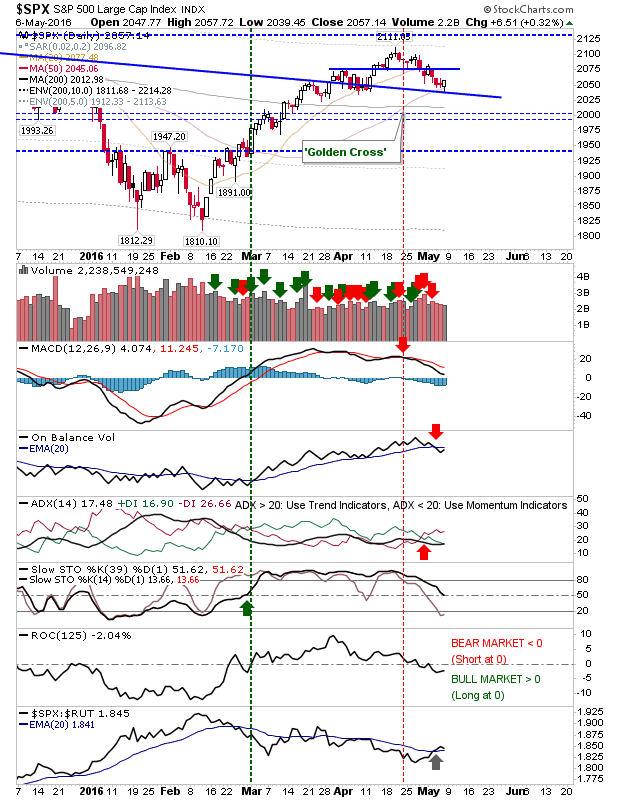
Today gave an inclination that selling could be slowing. Markets did experience modest losses, but these came on low volume and support is available for some indices. The S&P has bearish MACD, On-Balance-Volume and +DI/-DI signals to contend with, but does have converging support at declining trend and then the 50-day MA.

Sellers Keep The Pressure On

Image
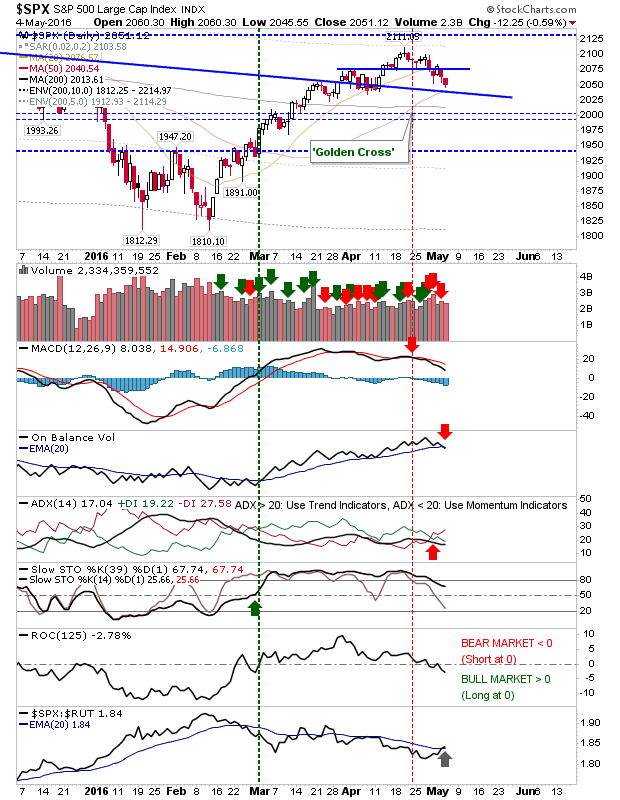
A weak start didn't follow through lower in afternoon trading, instead there was an attempt to defend Friday's lows. However, this defense didn't do much to push indices away from this support. The S&P experienced higher volume distribution, but is enjoying a relative strength gain against the Russell 2000.

Markets Rally But Breadth Remains Weak

Image
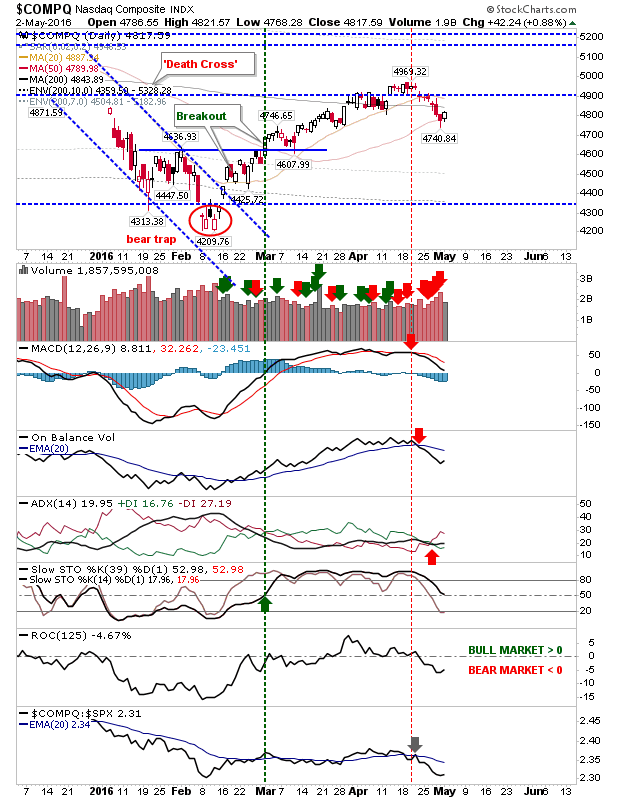
Monday enjoyed some follow through upside after Friday's afternoon recovery. However,  gains were on very light volume given the distribution which carried most of last week. Also, market breadth remains in decline from overbought levels. The Nasdaq frames this neatly. The rally has come off a bull defense of the 50-day MA on higher after a series of heavy volume selling days. MACD, On-Balance-Volume and +DI/-DI are in well established 'sell' triggers along with a sharp relative underperformance against the S&P.  Bullish dip buyers will be pleased with today's action, but other factors are running against them.

Semiconductors Breakdown

Image
Thursday's reversal in the Semiconductor Index was followed with a breakdown from the consolidation.  This will put pressure on the Nasdaq and Nasdaq 100 indices, the latter of which turned net bearish (in technical strength) on significant distribution.

Archive

Show more