Posts

Showing posts from December, 2009

Stock Market Commentary: Further Gains

Image
This will likely be the last post for 2009 as Christmas fast approaches. Markets added to yesterday's gains although large caps continued to struggle; maybe the S&P pushed a modest breakout? But volume was less than yesterday: Of sentiment indicators, the percentage of Nasdaq stocks above the 50-day MA gained upward momentum but it still is someway from September highs: Looks like markets want to maintain bullish momentum into the end-of-year. Unless something dramatic happens during the intervening period I don't expect much reaction until January. Have a great rest of 2009! Dr. Declan Fallon, Senior Market Technician, Zignals.com . November 2009 has seen a significant upgrade and is on course to becoming the eBay of finance with our new Beta MarketPlace and a new rich internet application for finance, the Zignals Dashboard . Zignals now has new fundamental stock alerts , stock charts for Indian, Australian, Frankfurt and soon Canadian stocks, tabbed stock list watchli

Stock Market Commentary: No Rest for Tech - Fresh Breakouts

Image
Just as things were looking sketchy for the markets; Nasdaq, Nasdaq 100 and semiconductors (the latter in particular) drive higher. There was a healthy level of support given seasonal factors and weather likely conspired to keep volumes down. Rising price channels remain intact: The Nasdaq 100 had a much cleaner breakout given it failed to break before as the Nasdaq did. Note new MACD trigger 'buy'. The real winner was the semiconductor index - the earlier breakout gained some validitiy. Even Small Caps got a little loving which kept their trading range breakout intact. A strengthening dollar kept the lid on large cap gains and there were no breakouts for the S&P or Dow - but in the context of a rally the leadership has to come from Small Caps/Tech. Looks like Santa has presents for some - but not all markets. Dr. Declan Fallon, Senior Market Technician, Zignals.com . November 2009 has seen a significant upgrade and is on course to becoming the eBay of finance with our new

Weekly Review of Stockcharts.com Publishers' Charts

Image
2009 is soon to come to a close. What have the last few days got in store for us? Richard Lehman of Trendchannelmagic.com is keeping an eye as to what the dollar rally may do to the overall markets. 12/19 -- First a few additions: I added an hourly chart on GLD to give added perspective on gold's moves and I also began adding some stochastic indicators on a few of the one-year charts to give a momentum perspective. In addition, I changed the order on a few charts so that multiple time frames would always appear from shortest to longest. The big event this week was the dollar's continued rise and breakout. That suggests that while it may back off in the very near term, it is finally shifting momentum to upward. Gold has been the most dramatically affected item by the dollar's rise, and oil to a lesser extent, but the equity markets have held up suprisingly well, continuing to trade sideways in large caps and actually higher in small caps. But if the dollar is going to spen

Weekend Market Commentary: Nasdaq 100 leads the Markets

Image
More of the same for the averages. On the weekly time frame the Russell 2000 remains the one to watch - a third resistance level is about to interact with converged neckline and horizontal resistance. A decisive break would give other indices a psychological boost. The Nasdaq is up against early 2008 trading range resistance and may yet break through. A MACD 'buy' in histogram may yet preempt the break but there has been enough buying in recent weeks to consume the supply it is currently experiencing. The Nasdaq 100 is showing the Nasdaq the way and is on course to test 1,978 resistance - the first of two reaction highs from 2008. With the Nasdaq 100 pushing ever higher it suggests both the Nasdaq and Russell 2000 will find enough to break their relevant resistance levels. Maybe Santa will make an appearance after all? Dr. Declan Fallon, Senior Market Technician, Zignals.com . November 2009 has seen a significant upgrade and is on course to becoming the eBay of finance with our

Stock Market Commentary: Breakouts Fail

Image
Markets broke out - tettered - then break down as attempted pushes to new highs reversed markets back into their prior ranges; the bad news for bulls is failed breakouts typically travel in the opposite direction very quickly. The Nasdaq is hanging on to its 20-day MA with channel support and the 50-day MA nearby to lend a hand; but if the latter break then it will be a smart run to the exits. Large Caps are looking more vulnerable; Dow has already lost 20-day MA support and hasn't yet made a test of its lower channel. Small Caps haven't entirely given up the ghost - but the breakout is looking very shakey. Converged 20-day and 50-day MAs will be important to hold. Semiconductors are also doing their bit to keep bullish momentum rolling. But it's hard to be optimistic for the S&P; there is a huge void down to the 200-day MA. What will Friday bring? Dr. Declan Fallon, Senior Market Technician, Zignals.com . November 2009 has seen a significant upgrade and is on course to

Stock Market Commentary: Breakouts Stall

Image
Tuesday was about questioning the validity of the breakouts. Today left that question unanswered. There is still the lingering issue of churn at resistance; the Nasdaq 100 demonstrated this best as it has yet to manage a resistance break: But the Russell 2000 continued its bullish push With the best news for bulls coming from the upside follow through in the semiconductors: While markets look weak there is still enough juice to suggest the broader markets can go higher. I have underestimated this market for too long to know otherwise! Dr. Declan Fallon, Senior Market Technician, Zignals.com . November 2009 has seen a significant upgrade and is on course to becoming the eBay of finance with our new Beta MarketPlace and a new rich internet application for finance, the Zignals Dashboard . Zignals now has new fundamental stock alerts , stock charts for Indian, Australian, Frankfurt and soon Canadian stocks, tabbed stock list watchlists, multi-currency portfolio manager , active fundam

Stock Market Commentary: Breakouts Vulnerable

Image
Losses in the Russell 2000 weren't enough to negate Monday's breakout, but breakouts for the Nasdaq and S&P are very much in the nip-and-tuck range as to whether their resistance breaks are still valid. For both the Nasdaq and S&P volume climbed to register a technical distribution day - a demonstration of churn at resistance. My expectations going forward from September were for a sizable correction in the Nasdaq. As we know, the Nasdaq did anything but - although the breadth indicators themselves weakened as much, and in some cases (such as the Percentage of Stocks above the 200-day MA) more than expected. September December Rallies can't survive without the health of the underlying components. At the moment, those components are experiencing selling stress - particularly on the long term time frame (as per 200-day MA stats). While the market may continue to favour the bulls into the end-of-year, next year will be a whole new ball game. My outlook for 2010 is fo

Stock Market Commentary: Breakouts in Nasdaq, S&P and Russell 2000

Image
Markets made their first move and pushed past resistance. The breaks were relatively small (other than a more decisive trading range break for the Russell 2000) but with any movement from tight range trading there is a good chance for further quick gains. Bears will be worried because even the slightest push higher has the potential to trigger a stop-cover frenzy. The Russell 2000 made the biggest break. With the S&P and Nasdaq closely following What's more compelling for bulls is the return in leadership for speculative small caps over the more cautious large cap stocks. Maybe Santa will make an appearance after all? Dr. Declan Fallon, Senior Market Technician, Zignals.com . November 2009 has seen a significant upgrade and is on course to becoming the eBay of finance with our new Beta MarketPlace and a new rich internet application for finance, the Zignals Dashboard . Zignals now has new fundamental stock alerts , stock charts for Indian, Australian, Frankfurt and soon Cana

Find Your Trading Strategy Today

Image
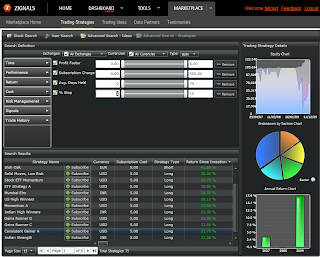
The new 'Advanced Search - Strategies' in the MarketPlace for Trading Strategies is now online. It works just like a stock screener, allowing you to customize the variables you wish to search for in a trading system; search by performance, number of trades, win ratio, profit factor and much much more. There is no charge to publish or subscribe to a trading system during Beta, so come give us a try - it's FREE . Looking to publish a trading strategy? Download the how-to-publish-a-trading-strategy PDF. Dr. Declan Fallon, Senior Market Technician, Zignals.com . November 2009 has seen a significant upgrade and is on course to becoming the eBay of finance with our new Beta MarketPlace and a new rich internet application for finance, the Zignals Dashboard . Zignals now has new fundamental stock alerts , stock charts for Indian, Australian, Frankfurt and soon Canadian stocks, tabbed stock list watchlists, multi-currency portfolio manager , active fundamental system stock

Weekly Review of Stockcharts.com Publishers' Charts

Image
In a week which saw little net change, is there a chance this week will be any different (the last full week before Christmas)? Open with Richard Lehman 's of Trendchannelmagic.com weekend summary: 12/12 -- A week-end review of the charts shows that while the large caps continue to mark time, small caps are going up and appear ready to bounce off lower mini channel lines this week. While small caps do tend to historically outperform in Dec/Jan, this lends a more bullish view to the near term situation. A breakout of the horizontal mini channel this week by the Dow would confirm that the large caps are finally joining the party. While many are expecting a correction soon, perhaps right at the beginning of the year, a breakout by the large caps could spur another leg up, particularly if it can break the long term (3-year) declining line, which has held the index quite well thus far. Bear in mind that the small caps have already broken that line going upward and have even successfull

Archive

Show more