Posts

Showing posts from February, 2014

Daily Market Commentary: Nasdaq Breadth Strengthens

Image
Very little change in the markets, but there was a net bullish turn in technicals for Nasdaq breadth metrics. The Nasdaq Summation Index is in a clear advance and is on course to reach an overbought state. This breadth metric is a good confirmation signal for swings in the parent index, and it's suggesting more upside.  For the Nasdaq Summation Index to reach an overbought state, it would take another couple weeks of gains in the Nasdaq.

Daily Market Commentary: Narrow Losses.

Image
After Monday's gains it wasn't such a surprise to see small losses today. It didn't change a whole lot and buyers can probably find some value for the next up swing. Certainly bears didn't get much out of today, despite the losses. Volume was down, another indication of the lack of interest from sellers (and buyers to a lesser extent). The S&P remains primed below resistance. Aggressive traders can use today's lows for stops - although a rapid intraday spike low may trap bears. The S&P still looks like it's playing for a higher push.

Daily Market Commentary: Small Caps Breakout

Image
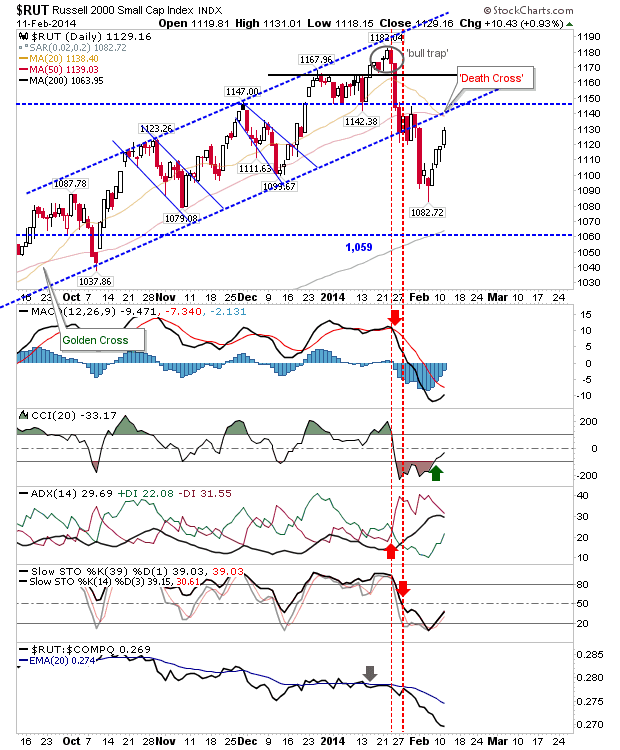
It was looking good for all indices in morning trading, but bears were able to knock back the S&P back inside its base by the close of business. However, the Russell 2000 was able to post a breakout, even if it hasn't gone all the way to new all-time highs, it has made inroads into challenging the 'bull trap'. The S&P will have another chance tomorrow. Today's weak finish was unable to undercut Friday's close, which will provide a platform for another push higher. The worry will be an undercut of the low on a gap down; it could panic rally participants into offloading in profit taking. The 50-day MA is the support zone.

Daily Market Commentary: S&P Tussle at Resistance

Image
The S&P is experiencing an interesting tussle at resistance, with 1,850 proving to be a difficult level to break. Volume climbed to register yet another distribution day, but Friday's intraday spread was narrow - offering a swing trade opportunity on break of day's high/lows. The tightening push against resistance would suggest bulls have it, but a gap down on Monday would likely see a rapid move to the 50-day MA. The loss in the Nasdaq was minor enough: Friday finished just below Thursday's close, holding the breakout. There was a climb in volume, marking it as a distribution day, but the point loss wasn't enough to make this a worry. Bulls may need to worry about a 'bull trap' - but there is lots of support to work with.

Daily Market Commentary: Quick Update

Image
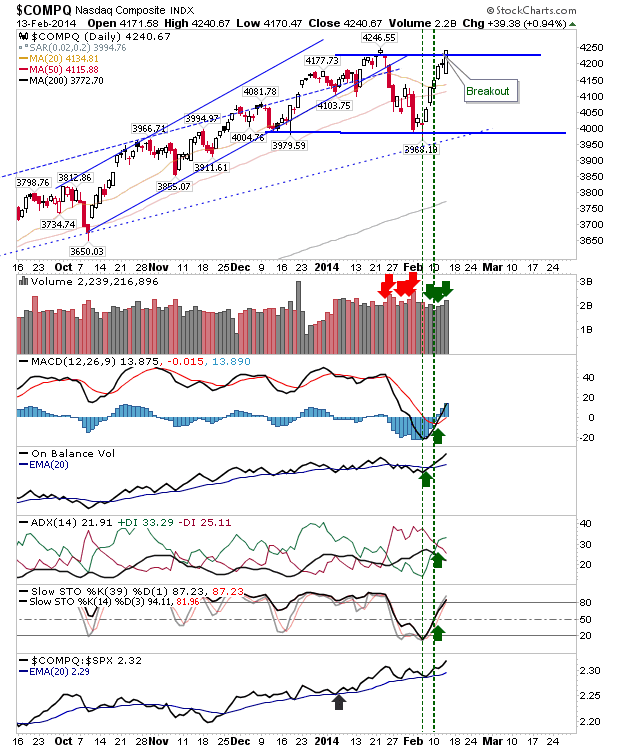
Bears found no joy after the first real day of selling for February failed to lead to anything. The Nasdaq maintained its breakout, and even managed to register an accumulation day: bulls can probably play for further upside with a stop below 4,225.

Daily Market Commentary: Failed Challenge on Resistance

Image
No surprise to see the S&P stall out as it challenged prior highs around 1,850. What's important is how the S&P behaves as sellers take a run at it. First support level is the 50-day MA, then 1,810, then the 20-day MA. Shorts may be able to squeeze something out of this on the way down, stops on a close above 1,850, but probably not one to hold on to for too long.

Daily Market Commentary: Small Caps Take The Limelight

Image
The shortened week started where it left off, with gains all round. However, it was left to Small Caps to enjoy the best of today's action. The challenge for the index will be taking out the 'bull trap' with resistance likely to be tested tomorrow. It may even offer a short play with a stop on a break of the 'bull trap' neckline.

Daily Market Commentary: Dow Reverses Breakdown

Image
The Dow was the most bearish of the indices heading into Friday, but despite the lighter volume it was still able to push above resistance, negating the breakdown. Friday's gain didn't do much to slow the relative strength loss against the Nasdaq 100, but with technicals net bullish it does mean weakness should be bought (until technicals turn net bearish). The Russell 2000 posted the smallest of gains. It doesn't change anything, but keeps the index net bullish technically. The Nasdaq kept its breakout intact, again, on the smallest of margins. The semiconductor index was able to build on its breakout, which is good news for the Nasdaq and Nasdaq 100 as they look to build on their respective breakouts. In contrast, Nasdaq breadth is improving, but hasn't yet turned net bullish. The Nasdaq Summation Index is usually the best proxy as the reversals are relatively noise free. The rally is in play, but it hasn't totally reversed the bearishness whic...

Daily Market Commentary:Technology Boom

Image
The semiconductor index ultimately offered a peek into what happened today. Following on the heels of yesterday's Semi breakout were breakouts in the Nasdaq and Nasdaq 100.  The Nasdaq breakout was supported by higher volume, no doubt driven by short covering. Technicals turned net bullish, ending January's bearish turn, and returning the market to its upward looking bias.

Daily Market Commentary: Stall Out

Image
It took a couple of days longer than expected, but the rally started from the swing low finally hit a stumbling block. Market ranges were narrow, and the gains or losses minor, which is more likely to help bulls as indices work new challenges of recent highs. Swing trades can look to trade a break of the day's high/lows, with a stop on the flip side.  But momentum is with the bulls, so any short-side break could be short-lived. Technicals for the S&P are net bullish, and will likely remain so for the next few days even if sellers returns.

Daily Market Commentary: Bullish Change in Technicals

Image
A surprising show of strength after three days of gains. Most surprising was the Russell 2000. It had looked ideally set up as a short play, but it made short shrift of resistance. However, technicals are still on the bear side, and there is the issue of a 'Death Cross' between 20-day and 50-day MAs. Shorts will next wait for the 20-day MA before attempting a second bite of the cherry.

Daily Market Commentary: Technology Gains

Image
It was relatively low key, but the Nasdaq and Nasdaq 100 were able to post a third day of gains. In the case of the Nasdaq, these gains pushed the index above its 20-day MA and for now, set a target of the high at 4,247. More importantly, the rally has managed to take out the mini-swing high from late January, giving bulls a little more confidence going forward.

Daily Market Commentary: Strong Second Day

Image
Buyers will have been relieved to have seen a second, decent day of gains following the losses at the start of the week. Volume just about registered an accumulation day, although there is perhaps some concern the buying of the last two days has come on lighter volume than the selling which took indices to these lows. There is also the case the swing low of February undercut the swing lows of December, setting in motion a possible shift in trend, or at the least, a new trading range. The S&P should have enough to take it up to the 20-day MA, where Friday's gains weren't enough to stop a 'Death Cross' trigger between 20-day and 50-day MAs. The rally will find it more difficult once it gets to this convergence, which is also a horizontal resistance level.

Daily Market Commentary: Relief Bounce

Image
Today was a relatively easy day for bulls. The decline had created a bit of a vacuum, which today's rallies happily filled. The semiconductor index worked itself off rising support, closing above the 50-day MA, but finishing below the 20-day MA.

Daily Market Commentary: Bullish Recovery

Image
It was looking a little worrisome for the Russell 2000 after sellers pushed the index below Monday's lows in early action.  The index gave back some of the recovered gains by the close, but not enough to reverse what amounted to a bullish hammer. Intermediate and short term stochastics are oversold, but there is no reason to suggest these will contribute to an immediate bounce. The 'bullish hammer' will offer a long side opportunity on a close above the high, risk based on a loss of its lows.

Daily Market Commentary: Bullish Challenge

Image
After yesterday's action it was no surprise to see markets claw back a small amount of those losses. Buying volume dropped, a trend which has been apparent since the failure of the S&P to break above 1,850. Technicals in the S&P are oversold, offering am opportunity for a bounce with relative strength swinging sharply in favour of this index.

Daily Market Commentary: Buyers Go Into Hiding

Image
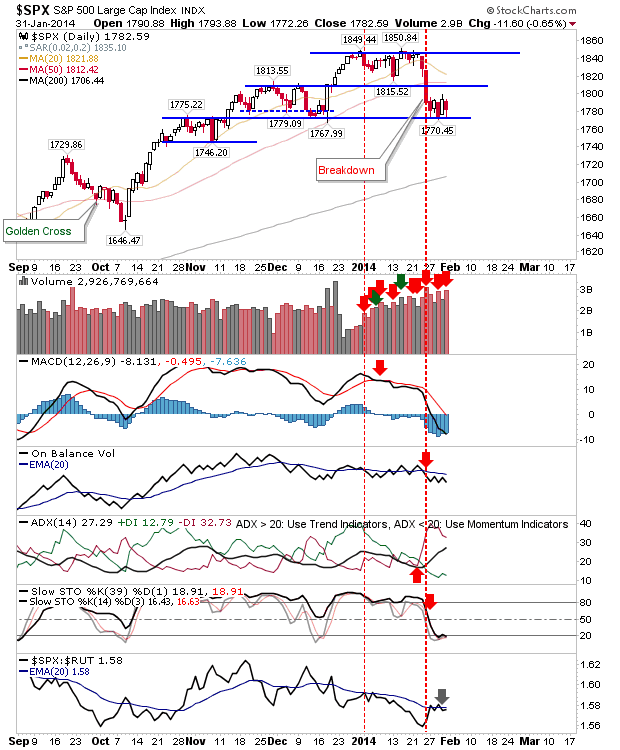
The battle between bulls and bears finally resolves itself in favour of bears. The end result differed by index, with some performing 'better' than others. Bad economic data was blamed for the fall, but this is a rally long in the tooth, and in need of a decent move lower to address the complacency built into this rally. The S&P decisively sliced through 1,770 support, barely pausing at a level bulls had, up until today, defended with relative ease. Selling volume climbed into yet another decisive distribution day. The 200-day MA is looking very enticing as a test level, although the market is oversold and short and intermediate term levels.

Daily Market Commentary: Heavy Volume Distribution - but - Support Holds

Image
One should give the edge to support - for now - but trading volume has consistently picked up in favour of distribution on days the market has closed lower. The S&P experienced another heavy distribution day as bulls kept the index above 1,770.  Technicals are net bearish, which means rallies should be sold into.  The 20-day MA is the area to attack if a short or looking to take profits on a support bounce.

Archive

Show more