Running a little late on everything this weekend. The MSFT-YHOO fun and games may have some dampening influence on proceedings for Monday, but how went the week?
Dr. Joe is watching daily machinations:
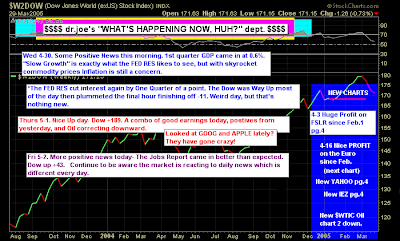
Although the dollar is attempting a run of strength (which will hurt gold prices); oil looks to have found a point of strength:

He has called a breakout in the Dow:
 Ted Burge
 is watching the Q's. A positive test of support?

The point-n-figure chart is looking for $53.59 off the May 1st Ascending Triple Top Breakout:
 Maurice Walker
 has called an end to the correction. His fan chart shows it nicely:

Maurice's commentary is a(nother) good one, although I disagree with him on the market not closing in bear market territory; in January of this year breadth indicators reached levels comparable to Sept 11th and the Asian Currency Crisis. We may have got strong bull markets from them, but the action which led to these lows was certainly bearish. However, what he says fits well with what
Richard Lehman suggests:
The Correction Is Over
In 58 BC Julius Ceasar started his conquest of Gaul. It took 7 years for Ceasar to conquer Gaul and it was only due to his strategical talents the campaign was so short. After this campaign, Ceasar decided to stay in Gaul with his army until he would be chosen as the new consul. His political opponents wanted him to get back to Rome and be prosecuted for the things he had done when he was a consul. Ceasar had made a decision, which resulted in the fall of Roman republic. He lead his armies across the river of Rubicon and said the well-known ' Alea iacta est' and started his march towards Rome on January 10th of 49 BC. Alea iacta est is Latin for 'The die has been cast,' meaning Ceasar was throwing the dice on his invasion of Rome like a crapshoot.
The decision to cross the river of Rubicon was a risky and uncertain venture. But the fall of Roman Republic occurred because Ceasar made a decision to cross. As a result of this war, Ceasar became the conqueror of Italy. Once he crossed the river Rubicon there was no turning back the decision had been made. Ceasar made a conscious decision to conquer Rome. Ceasar's opponents were over thrown because of a decision that he made to cross a river, likewise this market has made a decision this week to cross a river and there is no turning back. As we had anticipated, the intermediate downtrends are now broken and the birth of a new intermediate upward trend has been born. The changing of the trend has propel the bulls to power. Ceasar found little in the way of resistance in his march against Rome, and so will this market. The stock market is not a playground it is a battlefield and the bears were defeated this week. The decision to break above the declining trendline caused the market to over throw its opponents allowing the bulls to conquer the correction.
Since last summer, the bears have been telling us that the economy was in a recession and that the stock market was in a bear market. Every single so-called 'expert' that told us that US was in a recession was wrong. Those that told us that the stock market was irrefutably in a bear market were also wrong. The 1Q real GDP came in with a positive number, therefore during the first three months of 2008 the economy was not in a recession. Furthermore, the stock market failed to close in bear market territory. Yes, it's true, the economy actually grew during the first quarter of 2008 at 0.6 %. The important thing about this number is that it is positive. Now grant it, the US is growing at a snails pace, and I will concede that the economy is contracting. But just because the economy is growing below trend, doesn't mean that we are in a recession. It takes two consecutive negative quarters of GDP to academically define a recession. These 'so called' experts have ignored the economic facts and have caused a lot of hysteria among the masses. I don't think we will even get a negative quarter of GDP in 2008.
The bad news bears also told us that inflation would soon be spiraling out control, and that high energy prices would spill over into core inflation bringing the economy to its knees, causing stagflation. This week the year over year Personal Consumption Expenditures (PCE) core inflation rate for March came in at just 2.1 %. Proving the bad news bears wrong again. If you still think there is an inflation problem, then go to your local tire dealer and have him check your tires, because that is the only inflation problem you could possibly be experiencing.
Because inflation is not out of control, when you have a slowing economy you have a deflationary impact on inflation, disinflationary as long as prices continue to decelerate their rate of increase, while having a positive number above zero. You don't become deflationary until your under zero, in which prices drop and stop increasing. So right now there is a disinflationary effect in the economy. Disinflation is a decrease in the rate of inflation, a slowing of the rate at which consumer and wholesale prices increase. Inflation was lower in 2007 than in 2006, not higher. Additionally, inflation is expected to further drop in 2008 and 2009.
This week the Fed slowed the pace at which they had been lowering the federal funds rate, cutting it just 25 basis points. The market originally sold off on the news, with fear that the Fed would have to start raising rates to combat inflation. Then the next day the stock market shrugged off the news and rallied. But this approach by the Fed is actually a plus for the economy, it is good news that the Fed no longer feels that it is necessary that they have to aggressively lower rates, because the turmoil in the economy has mostly been stabilized.
Even the jobs report this week showed a better than expected outlook for the economy. The unemployment rate dropped in April back to 5 %, as the US only lost 20 K jobs rather than the 75 K that was expected. A recession has never occurred with a 5% unemployment rate, because a 5 % unemployment rate is consider full employment. But don't tell that to the obsession recession crowd, they won't believe you.
The federal government has promoted fiscal activity that is running counter to economic trends, by passing the stimulus package, while the federal reserve has aggressively cut rates. These two actions should have an impact on the economy by the second half of this year. The Democrats and Republicans should be praised for passing the stimulus package during this economic slowdown.
The breakouts could find some resistance here near the 200-day simple moving average. Which could allow prices to backtest the broken trendline. Once our current wave A has concluded, we should see wave B develop. After that, I think prices will rise to chanllege the October highs in wave C. However, I dont think that will transpire until the end of 2008 or the early 2009. The DJIA and the S&P 500 both got follow-throughs on the breakouts of their intermediate downtrends with acceptable volume, but the Nasdaq closed lower. Look for a backtest of the broken trendlines next week.
During wave B, I fully expect the bears to reemerge with their recession rhetoric and bear market rally talking points. Which will present another buying oppertunity for the bulls. Trend traders can either take a long term hold approach, while swing traders can sell into the rally once wave A concludes and then look for another entry point once wave B concludes.
Lastly, the DJIA monthly chart got some positive technical last week. The monthly chart got a bullish cross of the stochastic line and a higher MACD histogram bar, changing the slope. That should allow the MACD to get a bullish cross and then ultimately get negative divergence by 2009. If this scenario were to play out, the DJIA would exceed its October high. thechartpatterntrader.com
His inverse head-and-shoulder patterns are a thing of beauty:
 Richard
 is looking at new (strong) short term rising channels which are challenging long term downward channels.
5/3 -- Friday's blip (which was probably exacerbated by the short covering of folks who were watching the SPX pass above 1400) made the short term picture challenging, but I think its fairly clear now with the new channels I've drawn on the short term charts. The new channels encompass the moves of the past two weeks, which essentially were all mini channels. The larger channel shows a strong uptrend in the short term that is now pushing through the longer term declining lines from last year. (Except perhaps for the SPX, which I show as just now hitting its long term line from last September.) So, the picture remains up, though toppy for the major indexes.
5/2 -am- Sorry, my 5/1 post disappeared somehow. The breaks from Wednesday & Thursday turned into slope changes on the existing uptrends rather than new downtrends. A drop in gold and crude further fueled a rally back to the top of that uptrend, and now we may be reaccelerating upward as money pours back into stocks based on the S&P closing back over 1400. VIX hit the upper line on its hourly nad collapsed, remaining in its downtrend (though June and July futures expect it to turn upward by then). You have to go with this rally as extended as it is since that's where the money is going.
4/30 -- Breaks expanded today. The Dow, Naz, QQQQ, and SPX all following suit. The Dow's been right up against upper long term lines and today's touch was picture perfect! I couldn't buy the puts fast enough when the Fed announcement pushed things up to +150. Now we'll see what kind of follow through we'll get as we don't have enough data to draw new down channels yet. Remember the old Wall STreet adage 'Sell in May and go away'.

Finally,
Yong Pan has taken a more cautious view on the markets:


