Posts

Showing posts from September, 2021

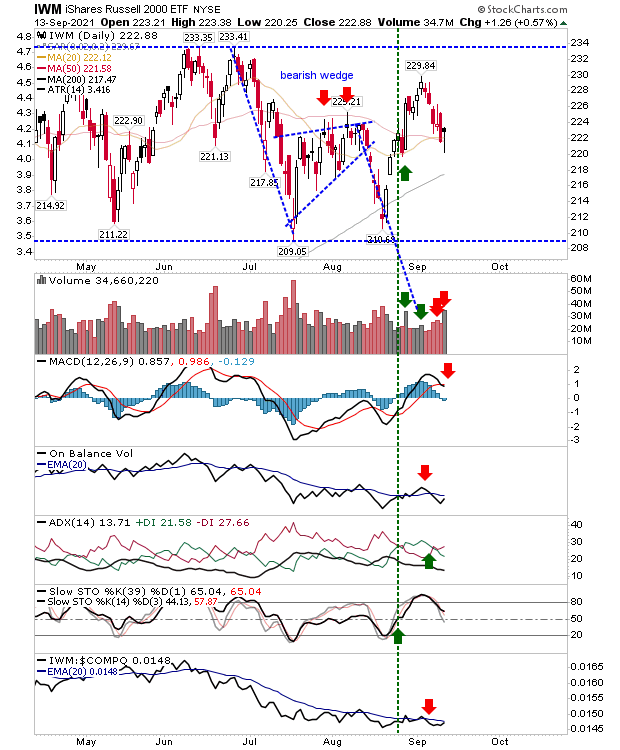
S&P pushes lower as Russell 2000 tags 200-day MA for a third time in two months

Image
The S&P followed through on its continuation pattern by delivering a solid red candlestick lower. Those big red candlesticks have also come with bearish distribution.  Next stop is the 200-day MA on net bearish technicals. 

Nasdaq breakdown follows that of S&P

Image
The Nasdaq finally gave in to the selling experienced by the S&P with a break through support defined by the July and August swing lows.  It came with a 'sell' trigger in On-Balance-Volume and an acceleration in the relative loss to the Russell 2000.  The next support level is the 200-day MA - a moving average which last saw a test in early 2020 when Covid first hit the headlines. It's hard to see buyers stepping in until we reach this moving average as there isn't a whole lot of alternative support to work with.

Resistance Test Due This Week for S&P as Semiconductors Prime For Breakout

Image
We have the Russell 2000 caught in a long term trading range, and despite registering a gain it hasn't changed the larger picture in favor of either bulls or bears.  The only index at a point of inflection is the S&P.  After breaking below the bearish wedge it now finds itself rallying back to former support turned resistance.  There are flickers of good news; intermediate stochastics returned above the bullish mid-line and Friday's close finished above the 50-day MA.

Breakdown gaps close as bounce continues

Image
The tough start to the week has seen much of this lost ground recovered, but getting to challenge highs is still some way off. The Nasdaq is at least approaching its 20-day MA as technicals see a small recovery with a new On-Balance-Volume 'buy' trigger. The index did successfully defend support connecting the July and August swing lows, although it did suffer a relative performance loss against the MACD.

Gaps down put pressure on bulls

Image
After weeks of gains which amounted to a series of low volume rises, we now find a more concerted action to the downside with gaps which may not get filled easily. In the case of the Nasdaq we had the August breakout stall and reverse with a move below breakout support.  I have drawn a secondary support line connecting the last swing lows.  This can be considered support until proven otherwise. Aggressive buyers may consider a positiom here, but the spinning top doji is a more neutral candlestick - suggesting price action could go either way.

Indices attempt support rally

Image
Markets aren't exactly powering higher but there is an attempt to develop some form of swing low.  The Nasdaq has the clearest opportunity. The last couple of 'white' candlesticks have developed at 20-day MA - well above closest (breakout) support. Add to that, we have 'sell' triggers in the ADX and MACD, offset by On-Balance-Volume and strong momentum from Stochastics. I'm liking the action even if trading volume could be a little higher.

Russell 2000 attempts to stall the decline as indices find support.

Image
A mixed bag for the indices as it was left to the Russell 2000 to try and extract some positives on the day. The Russell 2000 closed the day with a bullish hammer on support of the 20-day and 50-day MAs.  The 'hammer' almost game in as a dragonfly doji or indeed, a bullish harami cross. Again, we have to factor that this action come in the middle of a trading range, so it may turn out to be nothing more than noise.  Today's gain wasn't enough to stop a MACD trigger 'sell'.

S&P loses accelerate as Dow Industrials confirms 'bull trap'.

Image
We are starting to see a pick up in Large Caps loses as the bearish wedge in the S&P continues its move towards its ultimate resolution.  The index now finds itself at its 20-day MA with 'sell' triggers in the MACD and On-Balance-Volume.  Expectation is an undercut down to wedge support

Flat-line Day for Markets

Image
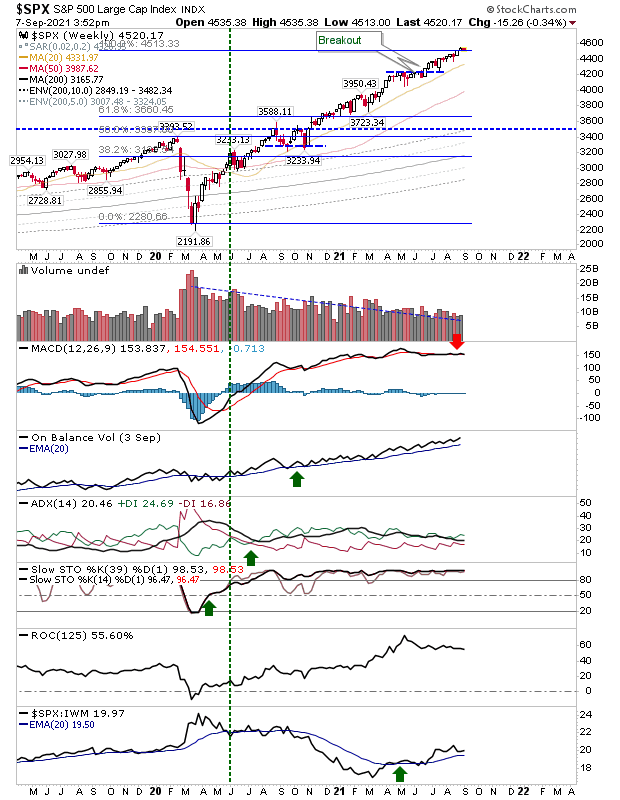
Most of the attention will have been on cryptocurrencies today, but for markets, it was another dull day.  The S&P barely moved the needle as it continued its snail-paced ascent. It's weekly MACD has effectively flat-lined with only its accumulation trend in On-Balance-Volume showing signs of bullish life. 

Nasdaq leads as Dow maintains breakout

Image
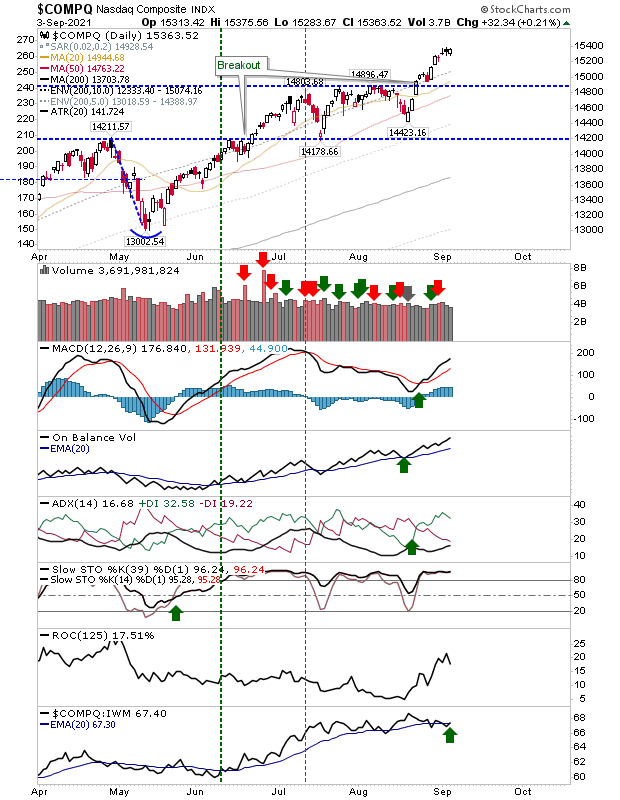
The Nasdaq managed to emerge with a small gain on Friday which was enough to return the index to its leadership roll. Technicals are net positive and despite Friday's lower volume it remains well placed to push on.

Russell 2000 takes on leadership roll

Image
The Russell 2000 hasn't yet cleared its trading range but it has regained its relative leadership role versus the Nasdaq and S&P.  Today's trading also came with higher volume accumulation.  While seasonal factors would offer a more pessimistic outlook, if the Russell 2000 ($IWM) was able to push beyond $234 it would deliver a whole new (bullish) market outlook. Supporting technicals are net bullish. 

Archive

Show more