Posts

Showing posts from October, 2013

Daily Market Commentary: Bearish Engulfing Pattern in Russell 2000

Image
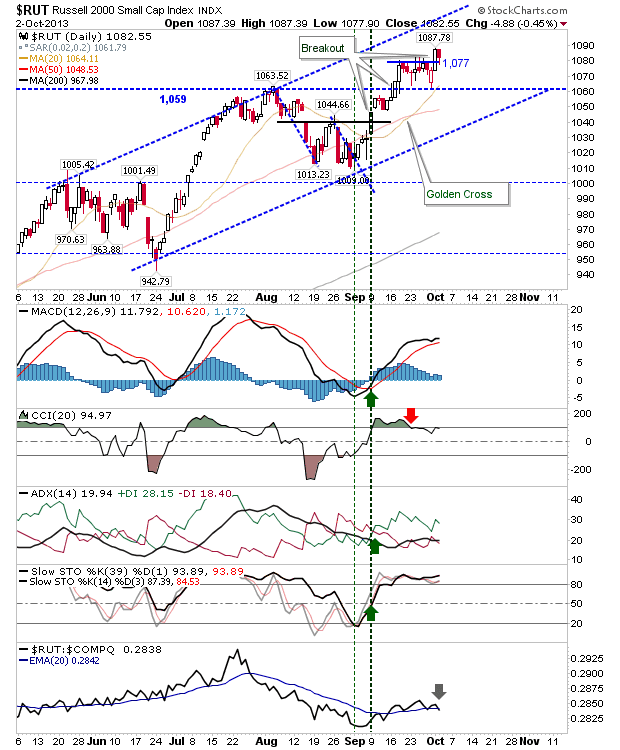
Small Caps took the biggest hit from sellers with a substantial bearish engulfing pattern (at least, relative to the last couple of weeks). The rally didn't make it to channel resistance, so it will be interesting to see how it does when it makes it back to its 20-day MA.

Daily Market Commentary: Semiconductors Big Gainer

Image
It was a specialists' day. The Dow was actually a big winner on the day: it posted a 0.7% gain while remaining inside its rising channel. It earned its gains on a background of quiet action in the other indices.

Daily Market Commentary: Low Key Action

Image
Little to say about the last two day's of action. Volume action was light, but with the exception of the Dow Jones Index, indices continued to toy with highs. The only real indication of change was a continued shift in relative strength from the S&P to the Russell 2000.

Daily Market Commentary: Gains Tick Over

Image
It was a good day for speculative Small Caps and Technology Indices.  The gains were modest, but the advances came on higher volume accumulation. Having said that, the semiconductor index didn't do enough to challenge the 'bull trap'.

Daily Market Commentary: Semiconductor 'Bull Trap'

Image
While scrolling through my charts I didn't see to much until I got to the semiconductor index. Horrible day for index - a big 'bull trap' which will prove hard to recover from after a 3.3% loss.  A move back inside of the gap should see a quick move back to 505, but beyond that could be a struggle.

Daily Market Commentary: Another Day Another Gain

Image
Anyone trying to short channel resistance at the S&P would likely have had a very brief trade. Today's action pushed the index outside of its channel, albeit on low volume.

Daily Market Commentary: S&P at Channel Resistance

Image
Monday started with a breather, and tight trading on a very narrow intraday range. Volume fell in line with a consolidation day. The S&P remained pegged by channel resistance on a doji. Aggressive players could go short with a stop just above channel resistance, although given the break of channel resistance in the Nasdaq and Nasdaq 100 there is a good chance it will follow these indices higher.

Weekly Market Commentary: Big Weekly Gain

Image
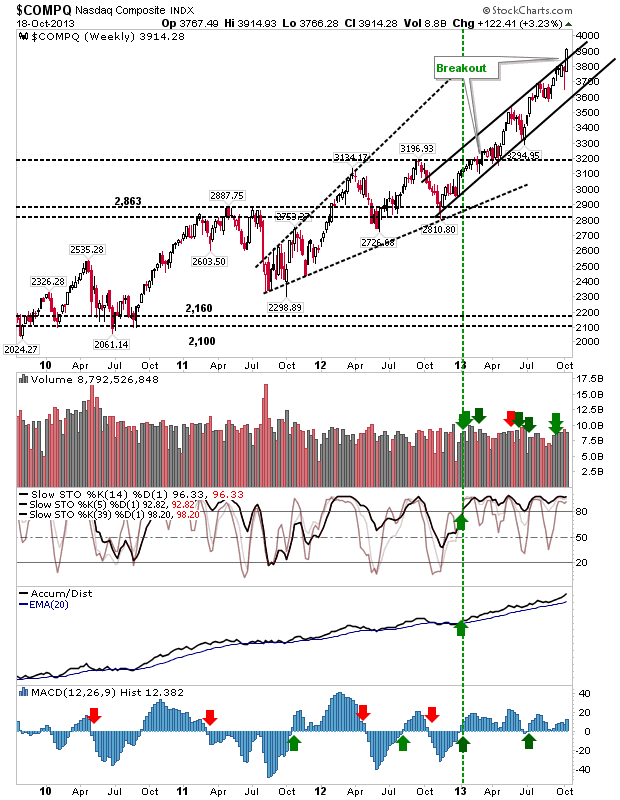
Indices enjoyed one of their best weeks in a long time. The Nasdaq finished with over a 3% gain to leave the index with a breakout from its rising channel. Technicals remain in good shape, although there is a bearish divergence taking shape in the MACD histogram - which will catch up with the index eventually - but it will take a 'bull trap' to confirm (a drop below 3850 on the weekly chart would probably suffice).

Daily Market Commentary: Upside Follow Through

Image
Looks like the Dow didn't get the memo; all indices continued their advance, except for the Dow, which headed south until pulled back in the afternoon. The Nasdaq pushed forward with higher volume accumulation.  It finished the day at channel resistance, but with the breakout to back the bullish picture.

Daily Market Commentary: Deal Struck Now What?

Image
So, the can is kicked down the road for another few months and buyers were willing to give the indices another boost.  The net effect was to erase much of the bearish creep in supporting technicals of the indices, but it has driven some indices back to resistance. Best of the action belonged to the Russell 2000.  The 'bull trap' was negated on yesterday's gain. The MACD trigger 'sell' was revered back to a 'buy', and the index offers plenty of upside room before it gets to channel resistance. Long traders will probably find the most joy here in the near term, with shorts looking for a second 'bull trap' before they have something to work with.

Daily Market Commentary: Markets Stall on Holding New Highs

Image
After three days of gains it was going to be difficult for markets to secure a fourth given debt ceiling fears. Volume climbed to register a distribution day, although overall volume was not particularly high (just high relative to recent buying volume). The S&P finished with a 'bearish engulfing pattern', look for further losses tomorrow.

Daily Market Commentary: Russell 2000 Breakout

Image
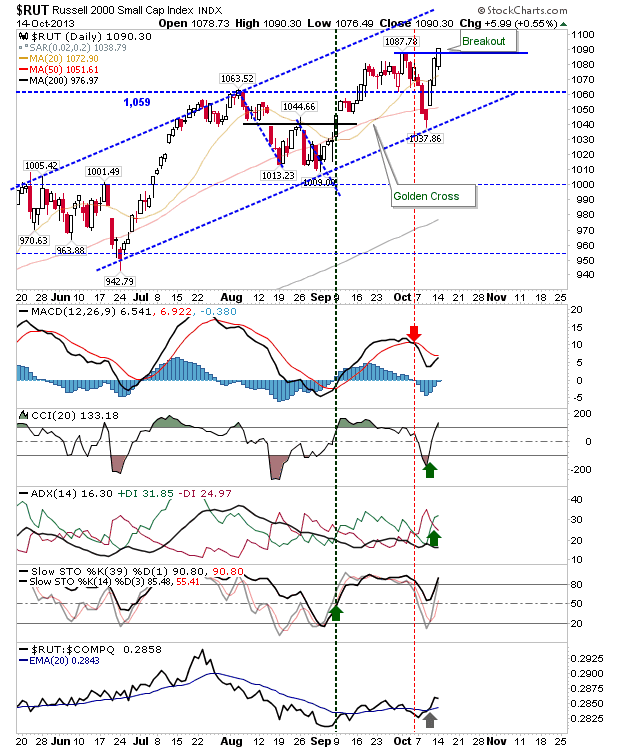
On the third day. bulls were finally able to take out the Russell 2000's 'bull trap' created by September's breakout. Technicals improved without taking out the MACD trigger 'sell'.  Those smart enough to have bought the test of channel support will have done well.  Next target is channel resistance.

Biotechnology Stock Revew: Array Biopharma ($ARRY)

Image
My fundamental review of Array Biopharma is available on the Motley Fool ; it didn't go down too well with some shareholders... My initial assessment (not the publish date of the article), was "bullish", but the last few days have tempered this somewhat. My original opinion was for a stock which had handily cleared $6.00 resistance on big volume, and (successfully) backtested the breakout gap at $5.50 before recovering.

Weekly Market Commentary: Russell 2000 about to challenge for New Highs

Image
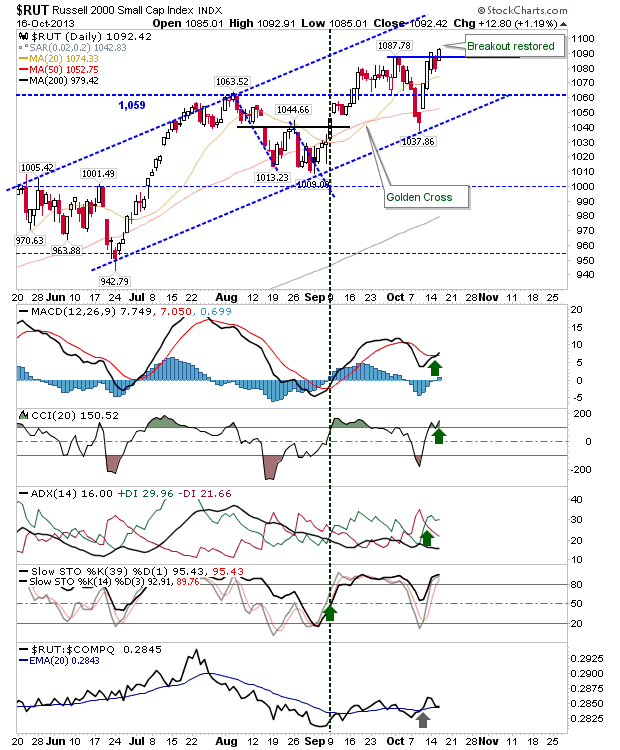
Good news for bulls, the Russell 2000 is only 4 points away from negating the 'bull trap' and re-establishing the rally from June. Technicals are just a MACD 'buy' trigger away from returning to their net bullish form. Cyclical bull markets are heavily dependent on leadership from more speculative, growth focused stocks as found in the Russell 2000. And given the action of Thursday and Friday it's clear it didn't take much to bring bulls back to the trough.

Daily Market Commentary: 'Bear Trap' Dow Jones Industrial Average

Image
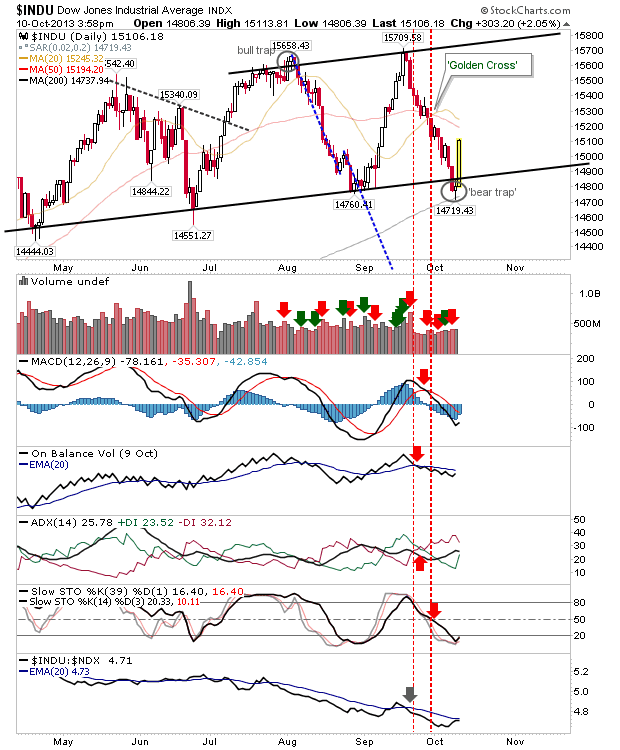
Big gains as uncertainty over the U.S. debt deal eased (although it was somewhat surprising to see so much buying). Ordinarily, one day gains as big as today's tend to be bearish over subsequent days and it will be interesting to see things play out over the next few days. The index best set to post further gains is the Dow Industrial Average.  Today's gains created a 'bear trap' in the index which makes any move back to the channel a buying opportunity. Stops go on a loss of the 200-day MA or 14,720.

Daily Market Commentary: Russell 2000 Tests Channel Support

Image
There were a number of support tests, but the clearest belonged to the Russell 2000.  The index made a picture perfect bounce off channel support, although the subsequent recovery didn't quite make it back to the 50-day MA. Technicals are just shy of a net bearish turn, but there is still time for this tomorrow despite today's gains. Watch for another down day which remains above channel support but below Wednesday's close.

Daily Market Commentary: Big Sell Off

Image
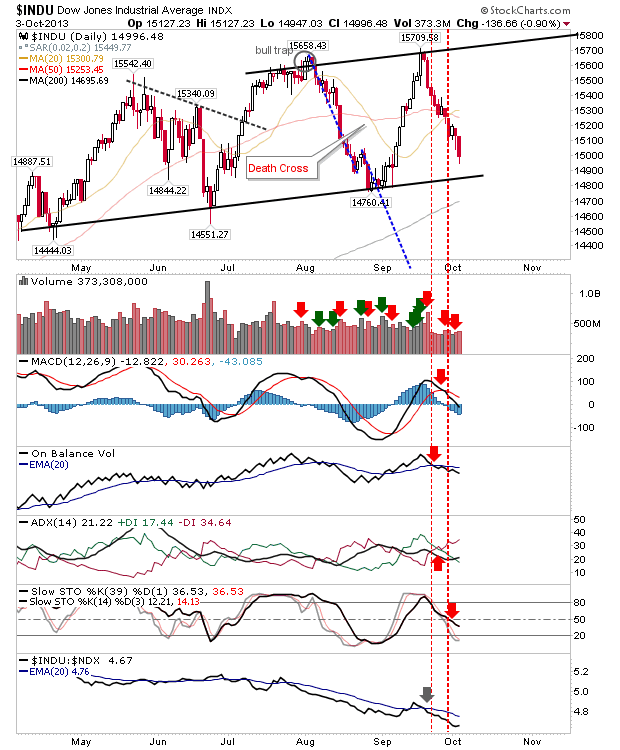
Disappointing not to see bulls make a better challenge on 'bull traps'.  Now indices are left with it all to do. Broader channels point to a bull trend, and it will be left to the Dow to indicate how such channels will play as support. The initial prognosis is not good. The Dow cleanly sliced below channel support and will probably see a test of the 200-day MA tomorrow.

Daily Market Commentary: Selling Pressure

Image
My weekly summary is of greater relevance after today's action.  Markets' just can't make their mind up - up one day, down the next. Today was the return of sellers on relatively light volume.  Large Caps carried the brunt of the selling, Tech indices were relatively resilient, while the Russell 2000 undercut its 20-day MA. The Dow is on its way to channel support, and will likely see this tested tomorrow. It may be enough for an aggressive long side trade, although the chance for a follow through to the 200-day MA is quite high.

Weekly Market Commentary: Acceleration in Russell 2000 Rally

Image
As things have got a little scrappy on the daily timeframes it's best to look at the weekly charts for some perspective.  The Russell 2000 has proved itself as the lead index with a sharp acceleration in its bullish trend since the end of 2012.  The narrow channel is the one it currently honors, although given the angle of ascent it won't be able to sustain that forever. The broader channel from the middle of 2011 is the one determining the secular trend.  When the narrow channel breaks, then look for either the resistance line of this channel to play as support (given prices are above such levels), or failing that, look for a move down to broader channel support - currently around 925.

Daily Market Commentary: Big Intraday Swing with Distribution

Image
Thursday proved to be a bit of a roller coaster, with some markets doing better in recovering big morning losses than others. Volume did climb to register a distribution day, but given the extent of the day's range I was surprised it was not higher. The Dow was again took the brunt of the day's selling.  Lower channel support appears to be the target, but wouldn't be surprised to see it go as far as the 200-day MA, an average last tested over a year ago.

Daily Market Commentary: Bulls Build Swing Low

Image
Another good day for bulls, where early selling was unable to take out the September low for the S&P or create a 'bull trap' in the Russell 2000. The Russell 2000 is offering the best bullish momentum opportunity - today's pullback a good potential entry.

Daily Market Commentary: S&P Bounce Off 50-day MA

Image
After a sequence of losses, buyers were able to assert some control on things. This was most evident in the S&P which saw a successful defence of the 50-day MA. It will take a few more days like today to see technicals improve, but it was a step in the right direction.

Archive

Show more