Posts

Showing posts from April, 2012

NetEase ($NTES) and Akamai ($AKAM)

My latest Motley Fool blog Post on Akamai and NetEase is available here .

Daily Market Commentary: Holding Station

Image
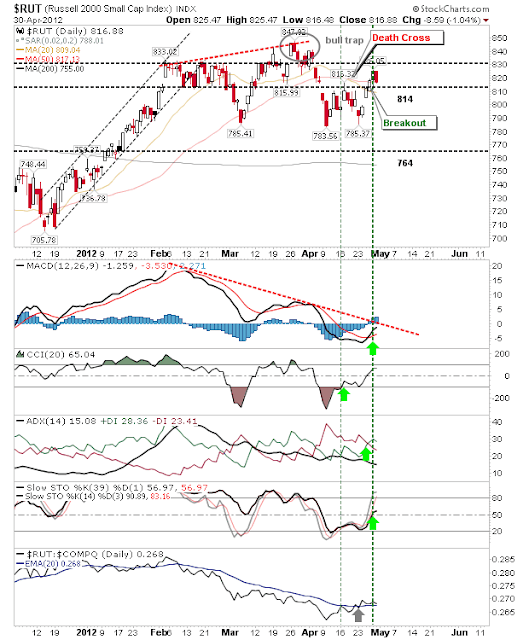
It was a relatively quiet day for the indices.  Losses were small and were on light volume.  There was an interesting contrast in the Russell 2000; the index experienced one of the larger losses on the day, but the loss was countered by a net bullish turn in technicals. The Russell 2000 finished at its 50-day MA and given the proximity of 814 support it offers a good opportunity for buyers tomorrow. The breakouts in the Nasdaq and S&P still hold as true despite today's loss. The other aspect working in bulls favor is the building of a swing low in market breadth; in particular, the Nasdaq Summation Index. Tomorrow could be a day to buy on weakness, particularly if there is a weak start (which might 'oversell' early). ---- Follow Me on Twitter Dr. Declan Fallon is the Senior Market Technician and Community Director for Zignals.com . I offer a range of stock trading strategies for global markets which can be Previewed for Free with delayed trade

Weekly Market Commentary: Breath Gains

Image
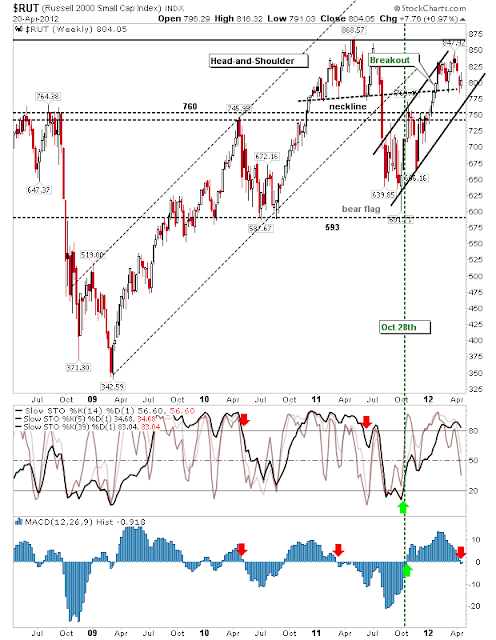
Market breadth staged a strong recovery after weeks of declines. The bounce is still a little early for some breadth indicators, but the gain was welcome. The indices enjoyed a powerful move off support and are well positioned for further gains. The Percentage of Nasdaq Stocks above the 50-day MA managed an 8 point gain to make it to 46% of Nasdaq. The Nasdaq enjoyed a higher volume engulfing pattern.  The 'engulfing pattern' is weakened by the lack of an oversold market for the Tech average, but this is an index which is well above nearest support. The feelgood factor extended to other indices.  The Russell 2000 continued to hold the former head-and-shoulder neckline as support and is threatening 830 resistance.  Bulls are well positioned to press their advantage. Likewise, the S&P worked off 1,370 support but has yet to challenge the 2008 high of 1,426. Next week, look for bulls to follow through with new high, continuing the rally started in 2011.

Daily Market Commentary: Upside Break

Image
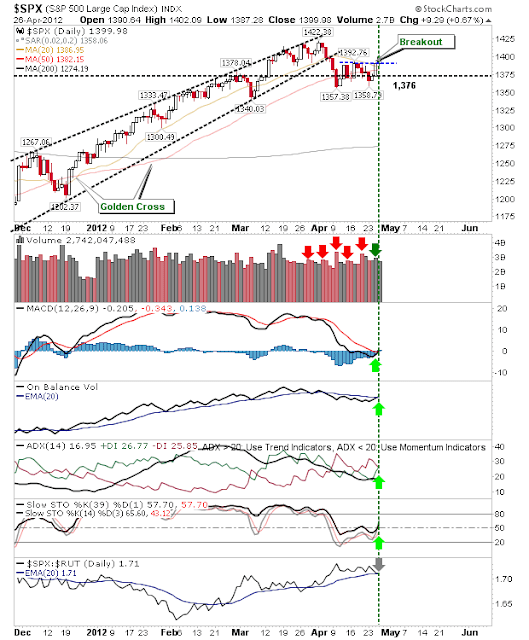
Better stuff from bulls.  The consolidation which has played out over the past couple of weeks broke out to the upside. Technicals improved alongside price action. The S&P managed a net bullish shift in technicals in one day; this supported the breakout and a close above 20-day and 50-day MAs. The Nasdaq managed to post a breakout on higher volume accumulation. Technicals aren't as positive for the S&P but are improving. Supporting the Nasdaq is a strong gain in the semiconductor index,  The index will encounter the first of its supply zones at the 20-day MA, but the recovery has been solid. Finally, the Russell 2000 enjoyed a breakout with a close above 20-day and 50-day MAs.  Technicals continued their improvement with a MACD trigger and +DI/-DI  'buy'.  Relative strength runs in favour of Small Caps over Tech indices (and Large Caps) and this keeps bulls in the driving seat. Tomorrow could see a consolidation, but bulls maintain the edge and

Daily Market Commentary: First Accumulation Day Since April Peak

Image
It has taken the best part of a month for markets to record an accumulation day, but today was one such day.  Volume, while higher, was only marginally so; making it a relatively quiet day for anyone not trading Apple (AAPL).  Despite the gain it was a tough market to trade given the bulk of the gains occurred pre-market. The S&P pushed far enough off its 50-day MA to close above its 20-day MA.  It's nicely poised to challenge the 1,422 high and to push some of its negative technicals into positive territory. The Nasdaq was able to regain 3,000 support and finish above its 50-day MA, but it was left below its 20-day MA which may offer shorts something for Thursday. Technicals are weak, but not oversold. The Russell 2000 is also poised to challenge its March 'bull trap', although it still has to break above overhead 20-day and 50-day MAs. Tomorrow offers a good opportunity for some upside follow through on today's accumulation.  Markets at or just be

Daily Market Commentary: Semiconductors Remain Under Pressure

Image
It was a mixed day for the indices.  Large and Small Caps staged a modest recovery on low volume which at least held back a selling follow through.  However, it wasn't such a good day for the semiconductor index, it closed lower on the day but it didn't break yesterday's low. It also held key support of 395 which is a strong vantage point to mount a challenge tomorrow. Weakness in the semiconductor index spilled over into the Nasdaq, although losses were minor and the March swing low wasn't violated. On more positive news, weakness in Tech has resulted in money rotating into speculative Small Caps (in addition to defensive Large Caps).  A break above 814 would be a very positive development - new longs could use yesterday's low as a stop placement, working on an assumption 814 will be breached. Tomorrow looks better suited for longs to work some magic.  The proximity of support - or at least a low risk stop - offers something for buyers.  Shorts will

Tow Precious Metal Players $GOLD and $PAAS

My latest post on Randgold Resources (GOLD) and Pan American Silver (PAAS) is available online .

Daily Market Commentary: Semiconductors Post New Swing Low

Image
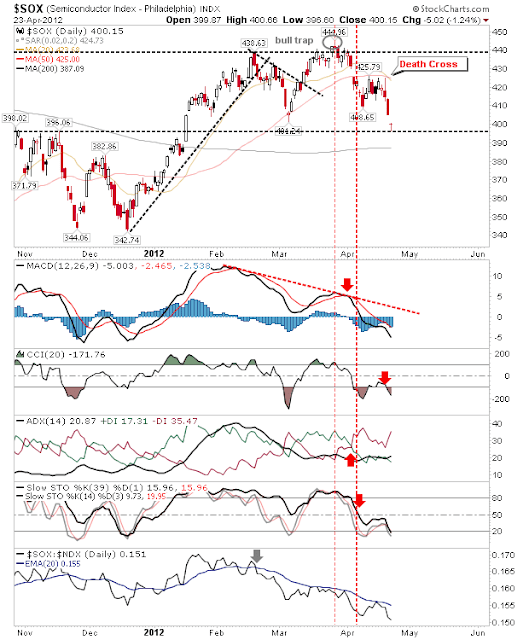
In an omen as to what may follow for the Nasdaq there was a new swing low in the Semiconductor Index.  Monday's gap down of just over 1% undercut the March swing low and left it with a 'Death Cross', but it finished above important support of 395.  Stochastics are oversold which sets up nicely for a bounce tomorrow, with a target of the 20-day MA. The Nasdaq was left with a gap below the 50-day MA on lighter volume, but it remains 70 points above 2,900. Neither is it oversold. But it also reverses the breakout of 3,000. The S&P is holding above the April swing low and is not oversold either. While the Russell 2000 is caught somewhere in the middle. With the exception of the Semiconductor index there is probably another day's selling in the tank before markets reached an oversold - and possible bounce point. --- Follow Me on Twitter Dr. Declan Fallon is the Senior Market Technician and Community Director for Zignals.com . I offer a rang

Weekly Makret Commentary: Attempt at Support

Image
Markets posted gains in what appears to be a test of support. Breadth also dug its heels in, although it's not at at an area where strong swing lows develop. The Russell 2000 is attempting support at the 2010/11 neckline, but it may yet require a channel test to firm up a lasting swing low. The Dow dug in at the 2011 swing high c 12,825, although the MACD switched to a 'sell' trigger. The Nasdaq remains well above its nearest support level which makes it difficult to predict where buyers may step in. The MACD is close to a 'sell' trigger, but isn't there yet. The Percentage of Nasdaq Stocks Above the 50-day MA is again attempting a swing low after the last one in March failed. Note, stochastics are a long way from an oversold condition. Although the Summation Index is still bearish and is probably a few weeks away from a bottom. The indices and supporting breadth give a mixed message which suggests it could be another week of indecisio

Daily Market Commentary: Stealth Distribution

Image
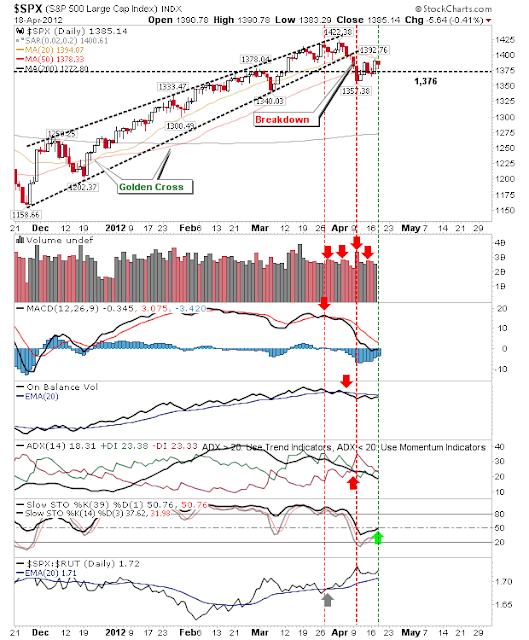
At first glance, the damage done by today's selling seemed light. But once volume was considered it carried a little more menace.  European troubles and weak economic data was given as today's excuse , but profit taking was a more likely factor in the selling. The S&P is dicing with its 50-day MA, finishing just below support. Shorts may find more on offer with 1,392 playing as resistance. The Nasdaq was rebuffed by its 20-day MA after a stronger start, but it too finished the day just below 50-day MA support. However, trading action is more sideways than short favored. While the Russell 2000 was surprisingly resilient given its weakness.  The 'Death Cross' between 20-day and 50-day MAs will offer shorts a stop point for positions.    Look for shorts to add to the selling pressure with 200-day MAs the target. --- Follow Me on Twitter Dr. Declan Fallon is the Senior Market Technician and Community Director for Zignals.com . I offer a range

Daily Market Commentary: Consolidation

Image
Markets were able to retain the bulk of yesterday's gain with only minor losses by the close of business. The only change was a modest improvement in technicals. But Small Caps struggled a little more with the index trading below both 20-day and 50-day MAs.  Shorts are likely working Small Caps harder than Tech or Large Caps. Meanwhile, Nasdaq breadth is working a swing low, led by the Percentage of Nasdaq Stocks above the 50-day MA.  But it will take a time to complete. For tomorrow, shorts will likely focus on the Russell 2000, while bulls will play the Nasdaq. --- Follow Me on Twitter Dr. Declan Fallon is the Senior Market Technician and Community Director for Zignals.com . I offer a range of stock trading strategies for global markets which can be Previewed for Free with delayed trade signals. You can also view the top-10 best trading strategies for the US, UK, Europe and Rest-of-the-World in the Trading Strategy Marketplace Leaderboard. The Leader

Daily Market Commentary: Low Volume Rally

Image
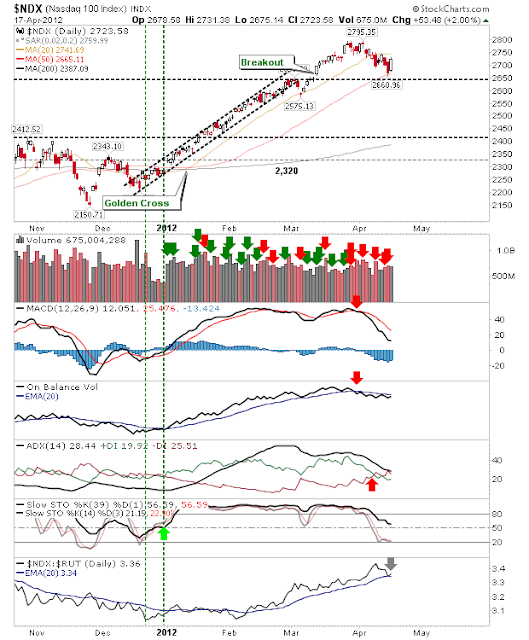
Markets rallied on positive economic data from the IMF, German economy and Spanish bond prices. The rally helped re-establish support at 50-day MAs for the Nasdaq and S&P, although the Russell 2000 is about to generate a bear cross between its 20-day and 50-day MA. The biggest winner on the day was the Nasdaq 100. It's 2.00% gain was driven by its prior defense of its 50-day MA.  Technicals are clinging to their bullish picture, although ADX, On-balance-volume and the MACD are in decline. The S&P regained its 50-day MA, but today's gain left it just below its 20-day MA.  But... The Dow rallied into its prior 'bull trap' and was able to regain its 20-day MA; good news for indices which are trading just below theirs. Technicals were even able to stage a recovery with a bull cross for on-balance-volume and ADX. The Russell 2000 is the index most in trouble.  The potential 'death cross' between its 20-day and 50-day MA will offer shorts som

Tech Plays: ADP and TXN

This is my latest post for the Fool and covers Automatic Data Processing (ADP) and Texas Instruments (TXN).  This is geared towards the long-term outlook and not the short term.

Daily Market Commentary: Tech Hit Hardest

Image
I was surprised the drop in the Nasdaq wasn't greater given the sell off in Apple and Google.  However, there was enough damage to see technicals shift net bearish on higher volume distribution.  Adding to the misery was a loss of 50-day MA support and the key psychological 3,000 level which defined the early March breakout. The S&P finished flat on the day, somehow escaping the selling which swept Large Cap Tech. Technicals were already net bearish, but neither are they oversold. The disparity extended to the Russell 2000.  Here there was a small gain, although technicals are also net bearish and trading well below its 50-day MA.  The index is also very close to generating a bear cross between 20-d x 50-d MAs. Adding to tech trouble is the bearish divergence between February and March swing highs and supporting MACD for the semiconductor index.  The index is loitering below its 50-day MA and attempting to create a new swing low. Markets at today's close

Weekly Market Commentary: Sharp Drop in Breadth

Image
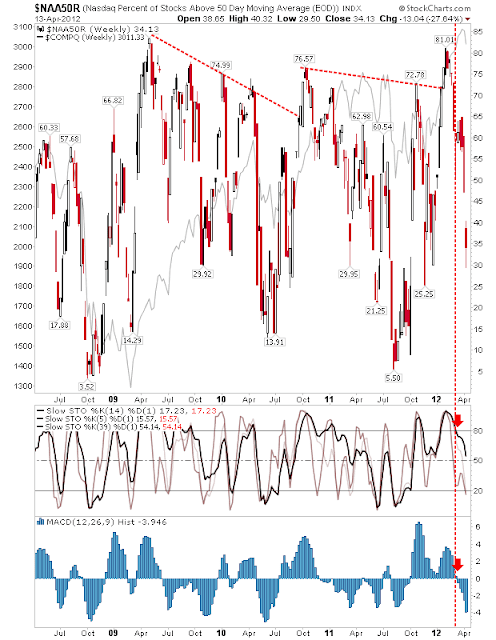
It was a bad week for Nasdaq breadth as the Percentage of Stocks above the 50-day MA gapped sharply down to 34% while the parent index lost just over 2%; this has left a significant bearish divergence between breadth and the Nasdaq. The Nasdaq Bullish Percents is still in the early stages of mapping a swing high.  Although a peak in this indicator doesn't necessarily correlate to a peak in the Nasdaq itself; see the Bullish Percent swing highs in 2009. As the Summation Index dropped out of its rising channel. Meanwhile the Nasdaq rebounded off broadening wedge resistance on higher volume distribution, but there is plenty of room to support. However, given breadth weakness some more downside is likely in the weeks ahead. Small Caps took their losses but it finished the week on neckline support. Rising channel support will soon converge with the neckline. Finally, the S&P closed the week on 1,370, but the losses weren't as great as for the Nasdaq and

Daily Market Commentary: Low Volume Gain

Image
Today continued with the low volume buying from yesterday.  The lack of conviction reflects doubts on the strength of the swing low, although buyers are not working in isolation. The Nasdaq built its rebound off its 50-day MA and breakout support, but will soon have to contend with overhead supply at the 20-day MA (3,074).  Despite the low volume over the last couple of days there may be sufficient momentum for it to push through the 20-day MA. particularly if there is above average volume trading in the morning. The S&P overshot its 50-day MA on Tuesday's decline, but it managed to regain this key moving average.  Like the Nasdaq it will soon have to contend with the 20-day MA, but is mounting its challenge from further back which will make it more vulnerable to attack by Shorts when it gets there. But the index most likely to see Shorts hit it hard is the Russell 2000.  The downtrending 20-day MA will soon converge with the 50-day MA, both of which lurk overhead.

Archive

Show more