Posts

Showing posts from November, 2013

Happy Thanksgiving!

Image
Back on Monday...

Market Sentiment: Sector Breadth

Utilities cut from the pack.

Daily Market Commentary: Tech and Small Caps' New Highs

Image
Bulls will probably be a little disappointed the trading week is cut short by Thanksgiving, as the Nasdaq, Nasdaq 100 and Russell 2000 all posted strong gains on decent volume. The semiconductor index also got into the action with what's shaping up to be a 'bear trap' and potential breakout. Only a MACD trigger 'buy' awaits for a net bullish turn in technicals.

Market Sentiment: Sectorbreadth

Charts of sector bullishness. Energy one of the biggest losers in price, and second weakest in sector breadth - a good bounce opportunity for Tuesday?

Daily Market Commentary: Low Volume Action

Image
It looked worse on the intraday chart, but today's late day sell off wasn't too bad in the context of the larger bullish trend.  Volume was also light. Shorts may try another crack at the market, but it's unlikely to offer much given the week that's in it.

Daily Market Commentary: S&P Pushes New Highs

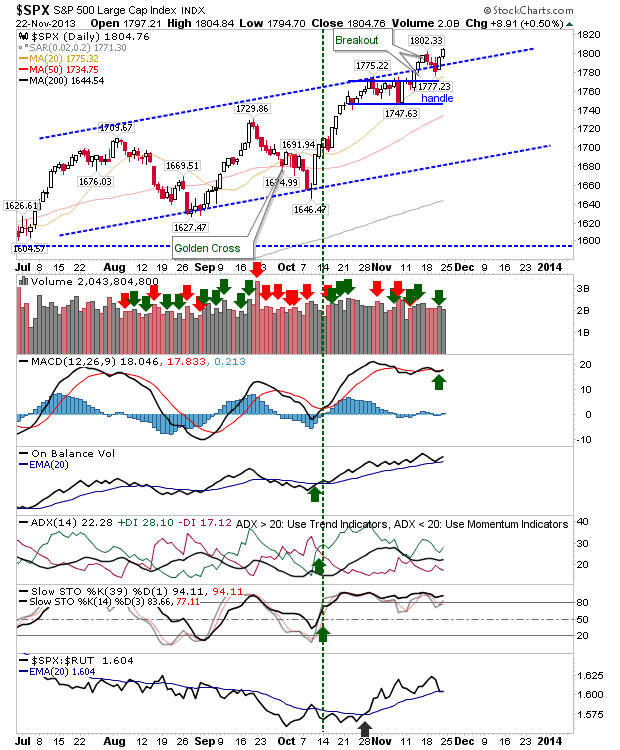
Image
Large Caps regained the momentum lost by three days of selling from the first half of last week.  Shorts in these markets will have covered on the break above 1,795, leaving them sidelined until the next opportunity arises. The shortened week is unlikely to offer too much guidance with Thanksgiving, so it will probably be a week featuring narrow range, but bullish action.

Daily Market Commentary: Small Caps Takes The Plaudits

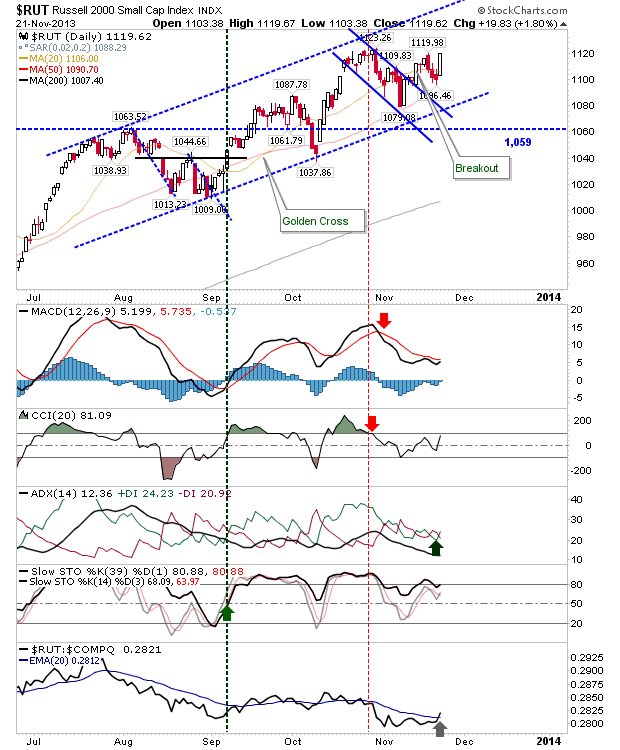
Image
A decent rally for the Russell 2000 regained all of the last three days of losses. The rally reignited the relative strength advantage of Small Caps over Tech indices after four months of underperformance. Technicals are on the mend and they may re-establish a net bullish setup by the end of the week.

Daily Market Commentary: Drip Losses

Image
Shorts will have been happy with today's action; small losses, an attempt to rally in the morning cut short, and late afternoon selling suggesting 'those in the know' were playing the side of the market they wanted to be. None of this changed much on the grander picture, which means bears may can sneak another few days like Wednesday under the radar before the retail market takes notice. The Semiconductor index was again the one where bears were finding it hard to remain orderly in the move to the exits. An undercut of the 50-day MA was a little too easy, although 0.5%+ gain today would see this important support level regained. The index looks on course to turn technically net bearish over the next few days, which would be reasonable expectation for further declines.

Daily Market Commentary: Semiconductors Break

Image
It's not a significant breakdown, but the Semiconductor index broke below wedge support, bringing it back to its 50-day MA. The last major break of the 50-day MA was back in August, when in gapped down to form a significant swing low. Support at 492 is more important than the wedge support lost today, but it does set a continued bearish tone for the Nasdaq and Nasdaq 100.

Daily Market Commentary: Nasdaq 'Bull Trap'

Image
A late day sell off took indices to their lows.  Carl Icahn's opinion on the market was enough to send some shareholders running for the hills, but only the Nasdaq and Nasdaq 100 came out with any significant bearish tone.  Both of these indices are on MACD trigger 'sell' signals dating back to early November. The Nasdaq breakout from last week was undone by today's selling, leaving a 'bull trap' and a possible (aggressive) shorting opportunity. However, the broader bull trend is dominant, and any short play would need to be assessed within this larger trend.  As for a downward target, the 20-day MA should see a test tomorrow, but the 50-day MA is a more attractive proposition.

Weekly Market Commentary: Nasdaq Breadth Weakness

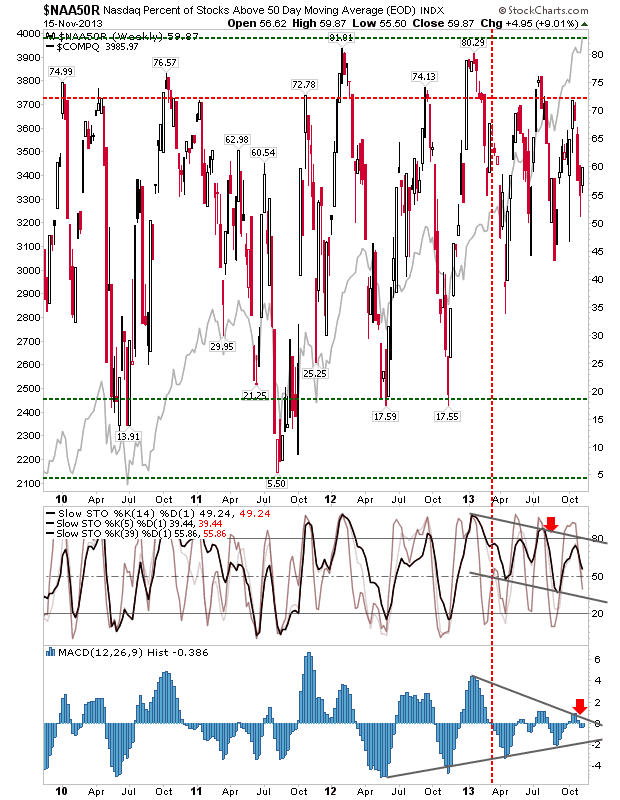
Image
If one was to only look at Daily Charts, all looks well: new highs, technicals net bullish, decent volumes.  Looking at the Weekly Charts offers similar optimism: well maintained trends dating back to 2011, sustainable (i.e. non parabolic) ascents, firm technicals. The only thing indicating a wobble are breadth metrics. The change in breadth metrics isn't outright bearish, and in itself may offer indices the basis for another big leg up, but the divergence to price is unusual.  It has expressed itself more in supporting technicals of breadth metrics, rather than the breadth metrics themselves. For example, the Percentage of Nasdaq Stocks above the 50-day MA peaked in late 2012 at 80%, but has struggled through 2013 to make a sustained move above 70%. It currently lies at 60%, which for a market pushing new all-time highs, is not particularly healthy.  In addition, the MACD histogram is narrowing into a coil and the trend for intermediate stochastics [39,1] points to a downward

Daily Market Commentary: Nasdaq and Nasdaq 100 Breakout

Image
Large Caps made their breaks yesterday, today was the turn of the Nasdaq and Nasdaq 100. The Nasdaq 100 breakout coincided with a second, relative strength swing back to Tech indices (from Small and Large Caps). Despite the swing, the Nasdaq hasn't returned to a MACD trigger 'buy,' and trend strength is weakening as determined by the falling ADX.

Daily Market Commentary: Breakouts Galore

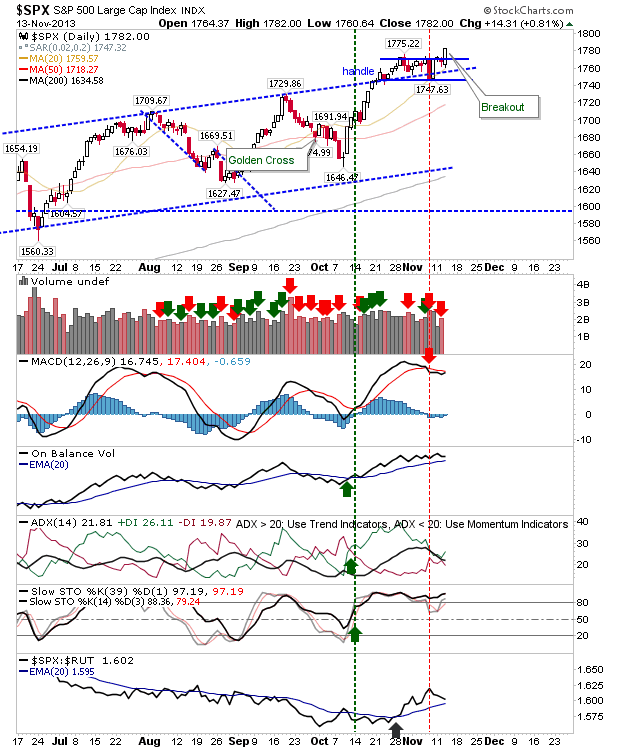
Image
Well, shorts would have had a very short-term trade; the need for tight stops apparent after today's action. Indices powered in afternoon trading to fresh breakouts, setting in motion the next phase of the rally. The cleanest breakout belonged to the S&P. It didn't quite come with a MACD trigger 'buy', but this is likely tomorrow.

Daily Market Commentary: Further Low Key Action

Image
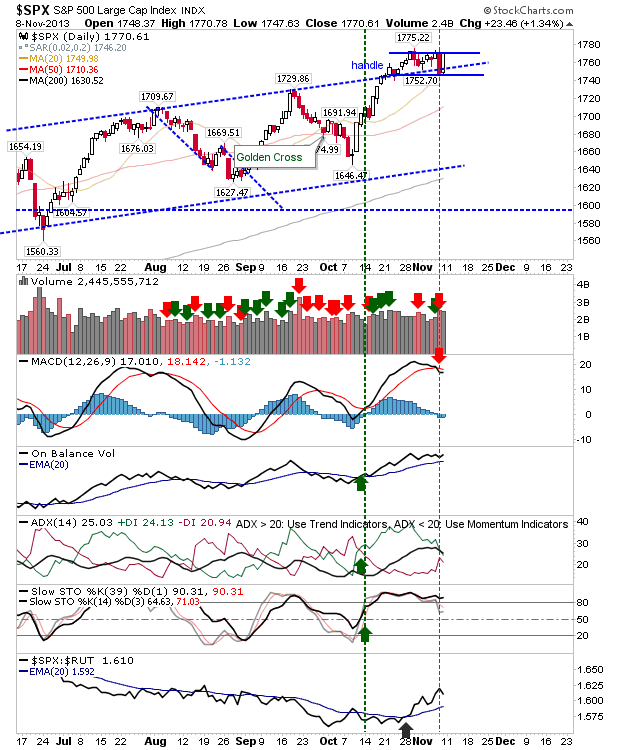
The scale of losses wasn't major, but there was a confirmed distribution day in the S&P (accumulation in the Nasdaq), only because Veteran's day volume was light. The S&P hasn't cleared its handle; neither has it negated its MACD trigger 'sell'.

Daily Market Commentary: Roll Friday into Tuesday - Little to add for today

Image
Out of today's action - the Dow might give shorts something to work with on Tuesday. The Veteran's day holiday was unlikely to generate a follow through day from Friday, but did well not to give back gains, which often happens in the absence of active buyers - irrespective of selling action. This makes any short position a considerable risk, but at least at today's close the risk of such short plays is low.

Daily Market Commentary: Low Volume Recovery

Image
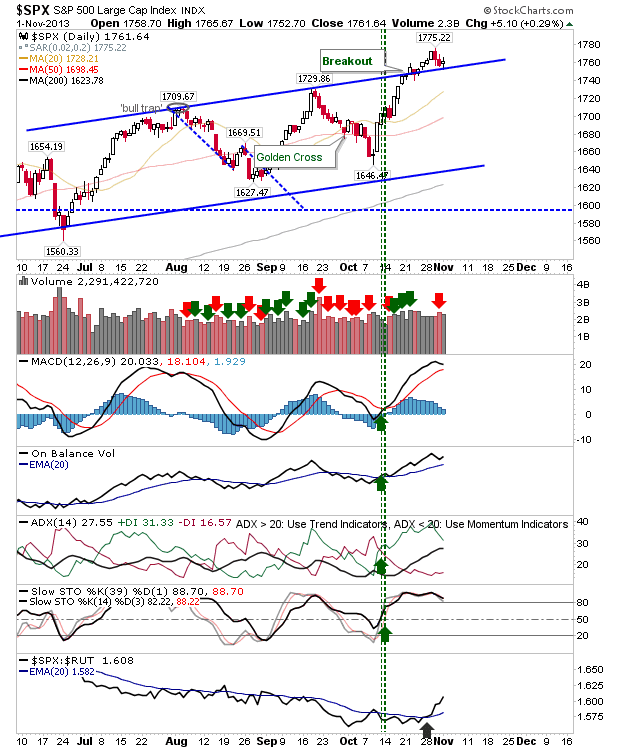
Decent day on Friday, even if it wasn't enough to recover all of the losses from Thursday. The S&P is close to undoing its 'bull trap', instead rallying back to resistance.  The net effect is to leave the index in a trading range, and shorts squirming.  It's not a full negation of the 'bull trap', but it's a good start.

Daily Market Commentary: 'Bull Traps' in S&P and Nasdaq

Image
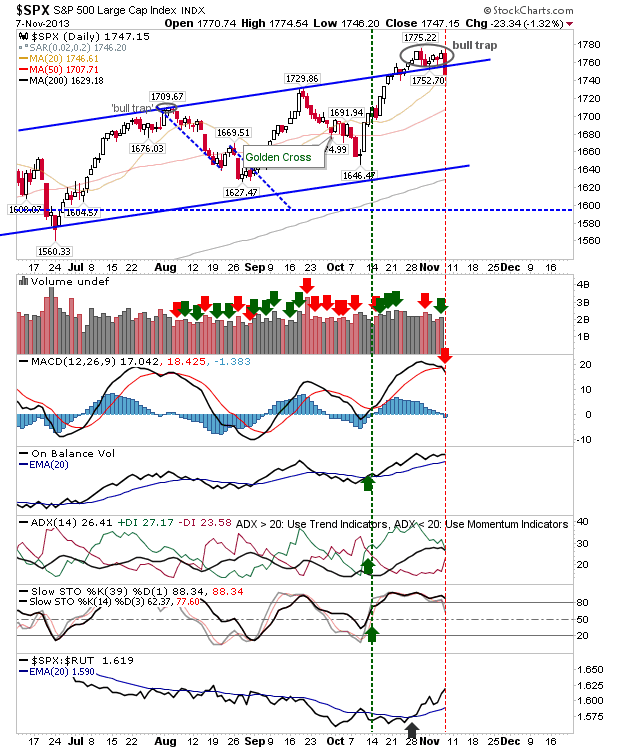
It looks like indices were doing their best to upstage Twitter's IPO .  Both the S&P and Nasdaq closed with 'bull traps', threatening larger pullbacks. It will take a push above October's highs to knock out the 'bull traps', which may take a few days. What today offers is an opportunity for shorts to take a shot at a possible larger move lower. The S&P also managed to log a MACD trigger 'sell', but countered by holding its 20-day MA. Assuming some defense of the 20-day MA on Friday, look for shorting opportunities as the bounce takes the index back to Thursday's open.  Stops go above 1,775.

Daily Market Commentary: Mixed Day for Markets

Image
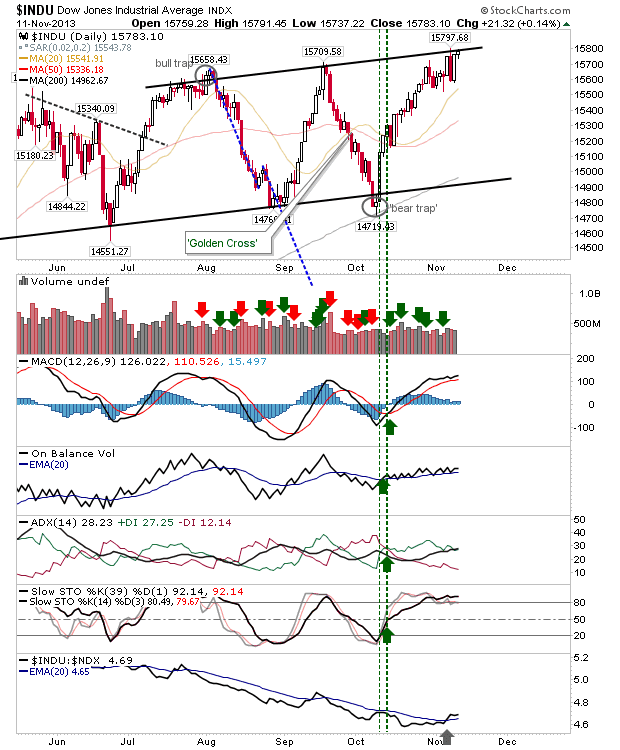
The flight to safety continued to play out with the S&P, and Dow in particular, enjoying gains; while the small cap Russell 2000 suffered. The Dow is fast approaching channel resistance as it manages to post a relative gain against tech indices. On the plus side, the S&P has long since pushed itself beyond such resistance; on the negative side, technicals are overbought, but not yet indicating a top.

One Millionth PageView

Image
In honor of my millionth page view (it has taken 8 years to get there...), a "What-if" scenario for those looking for a pop in this rally, next year. Outlandish enough to be plausible, but it would take a huge whallop for it to happen. I'm of the belief a major secular bull market is about to begin - if it hasn't already.  My ideal would be a decent cyclical bear market, perhaps taking 20-25% off the highs (whatever that may be), to get this new bull market rolling. The market has 'enjoyed' a scrappy consolidation since 1998 and is ready for stability. One more awkward leg down wouldn't surprise me here. View Chart All Contributions Welcome - Thank You! Follow Me on Twitter Dr. Declan Fallon is the Senior Market Technician and Community Director for Zignals.com . You can read what others are saying about Zignals on Investimonials.com . JOIN ZIGNALS TODAY - IT'S FREE!

Daily Market Commentary: Bulls Pull Back Early Losses

Image
Monday's nascent gain was challenged by early morning losses. However, bulls were able to regain the majority of such losses by the close of trade. The Nasdaq and Nasdaq 100 had the best of the day's action, going as far to post a modest gain. The Nasdaq 100 has a relative lead over the Russell 2000, and is attempting to regain relative strength against the S&P.  If there is an index to gain tomorrow, one of these is it.

Daily Market Commentary: Big Relative Swing to S&P

Image
Markets have been making baby steps up or down, but the one thing they haven't been able to hide is the broader swing back to Large Cap stocks, and away from speculative Small Cap and Technology stocks.  It's a growing flight to safety which will benefit S&P buyers, but is an indication of a larger move down - likely a test of 50-day MAs at least. With the S&P attracting what monies are coming from the sidelines, it will be important former channel resistance turned support holds.  Otherwise a shortable 'bull trap' will emerge.

Archive

Show more