Posts

Showing posts from December, 2008

Happy Christmas!

Back in the New Year. -EOM- Get the Fallond Newsletter Dr. Declan Fallon, Senior Market Technician, Zignals.com the free stock alerts, market alerts and stock charts website
Weekly Stock Charts review

Image
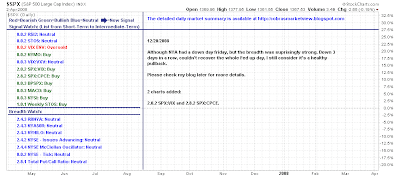
The last real trading week of the year has been a bit of a mixed bag. Santa will soon have come and gone, so is this it for his rally? Yong Pan has taken a distinctly neutral tone to his S&P breadth indicators, although his S&P take is bullish (with the exception of the single bearish signal 'creep') The bearish wedge remains in the SPY, except now things are looking overbought (and vulnerable to a sell off): Breadth indicators all showing 'buys'; intermediate time frame bullish even if the short term is a little rich: If there is a consolation prize it's that there hasn't been a significant distribution day since the post-Thanksgiving sell off: Maurice Walker has a bullish cross on record for the Aroon indicator: Maurice anticipates this rally lasting until the end of January (I think it will end around this time too) when 4Q GDP is released: The 4Q advanced figure will be announced towards the end of January 2009. I think the market will rally for a

Rising trends slowing; Transports and Semiconductors key

Image
Richard Lehman noted the change in slope of some of the early bull trends off the November lows. The reversal off the 50-day MAs was a big negative for me as the indices made a half-hearted attempt at defending them. Are things going into lockdown up to Christmas? Early vacation takers might see today as the last trading day for the year... I would like to see the Transports do more in the light of weak oil prices. Things to watch: Stochastics turning oversold - i.e. future short term weakness needed Consolidation triangle to break - with the 50-day MA pegged to triangle resistance it may be 'easier' for prices to break through support than resistance For November lows to hold as support For trend strength to continue its swing bullish, perhaps signalling a stronger start for 2009 My other sector watch is the semiconductors. Yesterday's strong reversal off the 50-day MA was very discouraging. Can the nascent rising channel hold? Stochastics heavily overbought - this

New KIVA loans

Image
Another three new project loans made possible from repayments by others. This brings the total number of loans made to 88 . It should be noted I have experienced only 4 defaults (4.24%) which is above the average of 2.85% but I still think is real good considering - especially when you compare it to first world defaults on subprime loans.... You can find more details on these individuals here . If you want to join the fun you should sign up for KIVA , or simply subscribe to my newsletter and your first month's payment will be allocated to a KIVA project of your choice. Get the Fallond Newsletter Dr. Declan Fallon, Senior Market Technician, Zignals.com the free stock alerts, market alerts and stock charts website
Money flow up sharply as S&P holds 50-day MA

A new 6-month reaction high in the Chaikin Money Flow indicator suggests bullish momentum holds sway as the S&P works on holding its break of the 50-day MA. Stochastics aren't overbought so there is room to the upside. The potential pitfall is the rising wedge pattern for December, but even if this breaks I doubt it will make it all the way back to its start at the November low. Potential for a bear trap. Get the Fallond Newsletter Dr. Declan Fallon, Senior Market Technician, Zignals.com the free stock alerts, market alerts and stock charts website

Large caps through; Tech and Small caps tag 50-day MA

Image
After months of struggle the Dow and S&P were able to push through their 50-day MAs following the Fed announcement on rates . The Nasdaq and Russell 2000 finished right on their 50-day MAs, closing shy of an actual break. With the exception of the NYSE, yesterdays gains didn't turn associated index stochastics overbought, preserving some leeway for further gains. McLellan Oscillator bullish Although the TICK is overbought Will the market view the Fed rate cut in a more negative light? Has the Fed shot its last bolt? How markets behave around their 50-day MAs will be telling. I still think there is more juice to this rally as breadth indicators, while neutral, are nowhere near overbought - even by (new) bear market standards. Get the Fallond Newsletter Dr. Declan Fallon, Senior Market Technician, Zignals.com the free stock alerts, market alerts and stock charts website

Financial Writer / Trader wanted $0-250K

Apply for Job Description Stansberry & Associates, one of the world's leading financial publishers, is looking for an experienced trader to write a weekly trading advisory. What's in it for you? Set your own hours… work anywhere… make over $250,000 per year… travel the world on our dime. Requirements -Must have at least 10 years of successful trading experience. -Must have proven trading methods that can be explained to the average trader. -Must be willing to live in Baltimore, Maryland for at least one year. (We operate from one of Baltimore's best offices - a beautifully restored 1850s railroad mansion with a full gym on-site.) -Must be highly competitive and obsessive about delivering the best possible advice to our readers. -Must love to read and write about the financial markets. If you don't love this stuff, don't bother applying. Stock trades… options trades… commodity trades… currency trades… it doesn't matter. If you're a great trader who can ma

Weight of 50-day MAs

Image
Bulls did a fair job of keeping the indices near their 50-day MAs. Now it's a question of holding rising support from November lows and breaking these averages; or losing rising support and retesting November lows. Prior demand favours a breaks of the 50-day MAs. Summation Indices firmly bullish; note 2 fan breaks already with a double bottom in each of the summation indices - if markets play to form they should take out November highs. Get the Fallond Newsletter Dr. Declan Fallon, Senior Market Technician, Zignals.com the free stock alerts, market alerts and stock charts website

Weekly Stock Charts review

Image
It's off and rolling for this week's review. A pending rate cut on a weaking dollar should be good for commodities; but how will our Stockchart.com ers see it? Yong Pan has seen an increasing number of neutral readings in breadth indicators having moved away from previously bullish positions. This is inevitable as part of a rally, but it leaves the market vulnerable on weakness. I like the possibility of a bullish triangle in the SPY, but the downside target cannot be ignored if instead a rising wedge plays out: Maurice Walker sees the rally in "good standing", with the backtest of the head-and-shoulder reversal pattern complete. Maurice pins his colours to the mast: Right now there is descension in the ranks of the bull camp. There is more than one doubting Thomas who was previously in the bullish camp, who is refuting the bullish portrait that has been painted here. But I for one am a believer! The bulls announced their arrival very boldly when they penetrated the

Zignals: When New Lows reach Extremes it may not be Bullish

Image
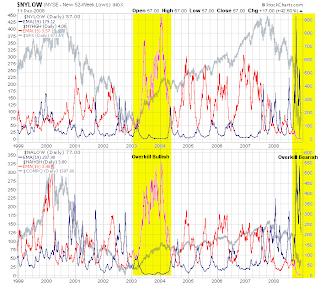
For the latter part of 2008 the number of stocks making new lows soared as the corresponding reverse for stocks making new highs flat-lined. This typically is considered a capitulation and a strong indication for a bottom, but it may not mean a bottom for all stocks. In 2003 to early 2004 the reverse situation occurred where the number of stocks making new highs wiped the floor of stocks making new lows. The first peak in mid-2003 did not mark a top as may have been expected, although the shift in momentum following 3 years of selling was enough to keep the bullish advance intact. The second peak - which closely approximates the second peak markets are making now in new lows - did mark the eventual top for that cycle, but it did not bring a collapse in market prices; instead it kicked off a steady advance where the trend in stocks making new highs fell as fewer sectors (and therefore stocks) participated in the rally. Eventually the last sector standing was the energy sector which even

Failed Bailout means test of December 1st lows.

Image
Futures aren't taking kindly to the failed bailout of the US auto industry. What this means for today is a probable test of the low created by post-Thanksgiving/Monday selloff. For the S&P we are talking around the 820 mark: One can see from the TICK that short positions are favoured. But the significant bullish divergence in the number of stocks making new lows favours a more meaningful rally similar to that of this summer (where the prior reaction high got knocked out - even if in the end the S&P continued to tumble). The best case scenario here would be a rally all the way back to declining resistance in the 1,200-1,300 range. It will take baby steps first; look for retest of 820 than rally to 1,000 before a another run at 850 before the final push to and beyond 1,000. I would give this a time scale of 2-6 months. Lets watch and see what happens... Get the Fallond Newsletter Dr. Declan Fallon, Senior Market Technician, Zignals.com the free stock alerts, market aler

Markets Behaving Well

Image
With the indices spending another day near joint resistance of declining channel lines and 50-day MAs, each are nicely set to push higher, although momentum oscillators favour a retreat. The Nasdaq looks best positioned to move higher as it spent a third day above 1,534 near term support. Transports behaving well with the slump in oil prices. With stochastics overbought it will be important for the next downleg to make a new higher low: Same goes for the S&P; the mini-pennant for the past 3-days is likely to breakdown given overbought stochastics and the presence of its 50-day MA overhead. There is more to like here about the markets and I suspect the real value buyers will take advantage of the next downleg, thereby helping in creating the higher low. Get the Fallond Newsletter Dr. Declan Fallon, Senior Market Technician, Zignals.com the free stock alerts, market alerts and stock charts website

Breadth indicators on their 5th attempt at a bottom...

Image
The ol' guard breadth indicators have had a rough year detecting the bottom. I was of the opinion the January bottom was ' the One ' but this was later proved to be folly once the July retest collapsed in September. We now have new lower boundaries for the breadth indicators which gives us a base going forward. These boundaries show considerably upside room - even if this room is only to former bull market support (let along resistance!). The late October attempt at a bottom wimped out with new market lows, but as happened in March we have a bullish divergence between the breadth indicators and the market itself. Even in March this was enough for a 2-month rally. Another 2-month rally here would fit seasonal trends in addition to been a welcome relief. Get the Fallond Newsletter Dr. Declan Fallon, Senior Market Technician, Zignals.com the free stock alerts, market alerts and stock charts website

Inflation round the corner?

Image
One of John Murphy's intermarket watch areas was the relationship between the 10-year treasury note price and the price of oil. The patterns of inflation, stagflation and now deflation are clear for all to see. I had posted on the shift to stagflation in February 2008 , but things look very close for a return to inflation given the disparity between the two. Inflation is a normal course of action in a strong economy, but how this will impact on the current state of affairs remains to be seen. When inflation does return it will be bullish for commodities and commodity based stocks, but I am still of the belief gold has to drop more in line with other commodity prices - with that of other precious metals - before a bottom can be declared in commodities and the next up leg (with inflation) can begin. Get the Fallond Newsletter Dr. Declan Fallon, Senior Market Technician, Zignals.com the free stock alerts, market alerts and stock charts website

Weekly Stock Charts review

Image
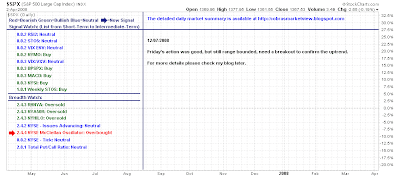
A relatively respectable close to the week after Monday's horrors, how did the Stockchart.com folks see it? Yong Pan's S&P and breadth watch has seen nascent bearish signals turn neutral/bullish. But he is waiting for the rangebound action to break before getting too confident. His charts show technicals in a more neutral position; could go either way: His observation on action following the November bottom is bullish: Breadth indicator buy signals matched with bullish divergences in those indicators and a bullish wedge breakout: Maurice Walker saw Friday as a gunfight between bulls and bears. The bulls have take bold action and aggressively pushed prices above the intermediate downtrend, causing the inverse head shoulders pattern to garner support, which means that it has a strong chance to flourish and play out. The bulls took a leap of faith across the trendline, not allowing the bears to chip away at this rally any further, and sent them packing to get out of town bef

Archive

Show more