Posts

Showing posts from June, 2021

Breakouts Hold on Minor Changes as Russell 2000 is Poised To Follow

Image
The Nasdaq didn't lose ground, keeping its breakout run intact. Technicals are net positive with no bearish divergence to be concerned about.

Russell 2000 Tags Resistance as Nasdaq and S&P Breakouts Hold

Image
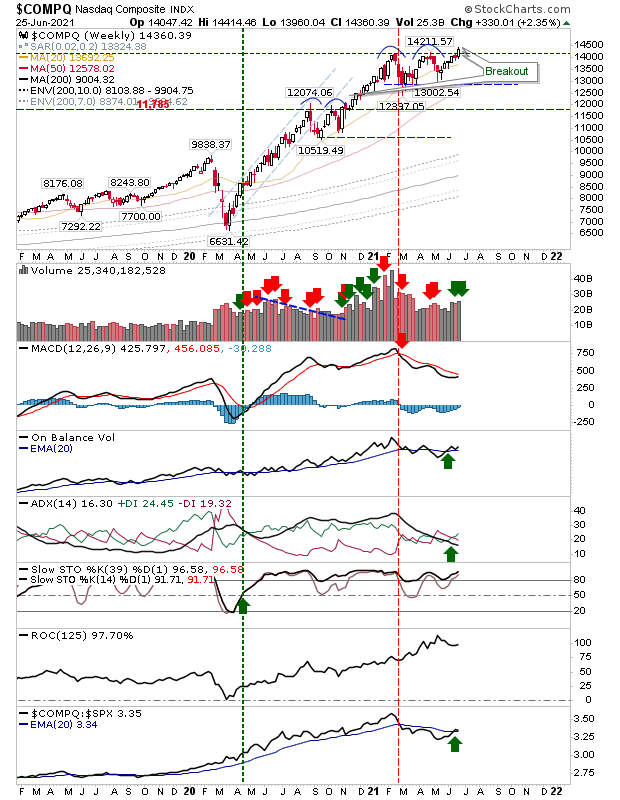
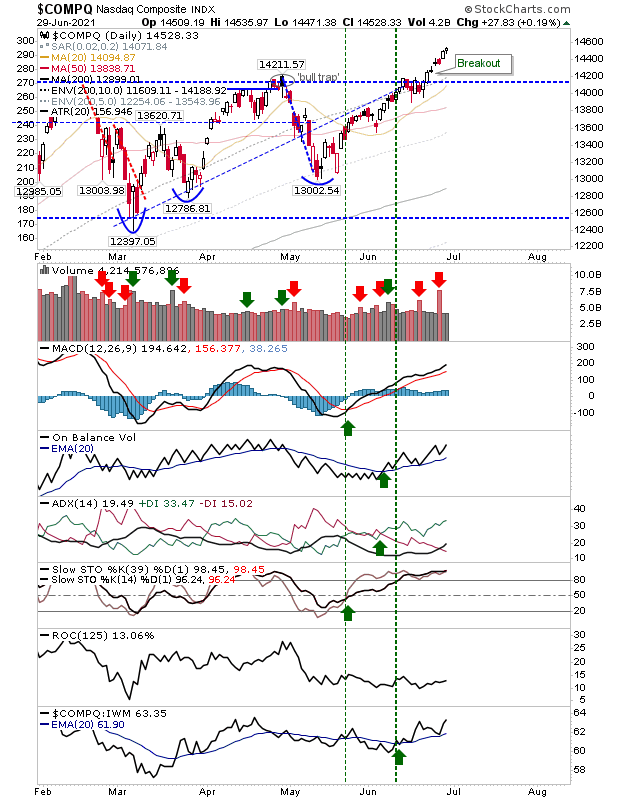
There wasn't a whole lot of change on Friday, although the breakouts established in the S&P and Nasdaq held.  The rarity of triple tops was confirmed by the third attempt by the Nasdaq to break resistance as it did during the summer of 2020.  The breakout was established with a confirmation in On-Balance-Volume 'buy' signal and a relative performance advantage over the S&P

Tech Indices Hold Break Out

Image
Yesterday's push above resistance for the Nasdaq was retained on today's tight action.  Technicals are net positive and outperforming the Russell 2000, although trading volume was relatively light. 

Large Caps turn south; Russell 2000 remains range bound

Image
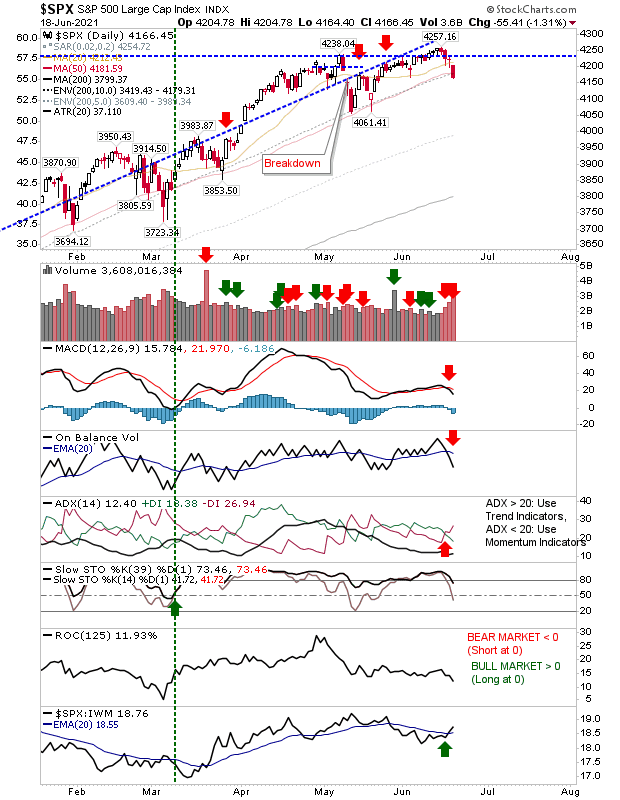
We are seeing more definition in the trend direction for some indices, but even with Friday's losses, a more likely outcome for the weeks ahead is sideways trading with May lows a potential support anchor for this. The S&P undercut its 50-day MA on Friday's close on higher volume, although options expiration will have weighed on the volume.  May's swing low is next, which if held would mark a new level of support for my suggested trading range. 
Nasdaq Primed to Breakout as Russell 2000 tests 50-day MA

Image
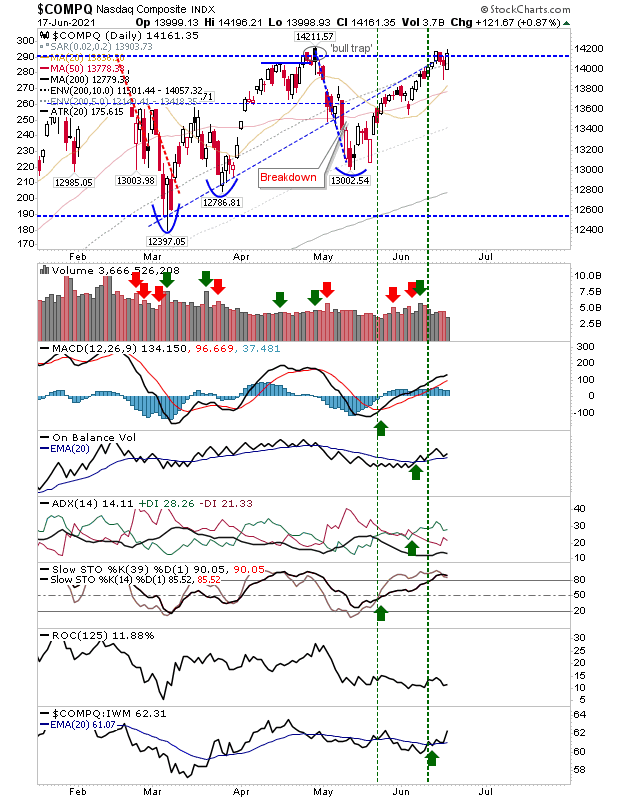
Some decent stuff from indices without rocking the boat. The Nasdaq is back pressuring the 'bull trap' as it looks to break to new all-time highs above 14,211. Technicals are net positive including a relative performance advantage over the Russell 2000.  Trading volume is a little light for a resistance challenge, but I would look for this to change on the break.

Nasdaq Rebuffed By Resistance

Image
Yesterday's gains in the Nasdaq pushed above resistance to challenge the April 'bull trap', but there wasn't the follow through needed to maintain the breakout. Technicals are net positive including relative performance versue the Russell 2000.

Russell 2000 Set Up For Breakout

Image
Friday didn't offer a whole lot for Large Caps or Tech Indices; volume was down and the net position for the indices was unchanged.  The Nasdaq is caught below internal base resistance (anchored by the March swing lows).

Small Caps confirm support with test

Image
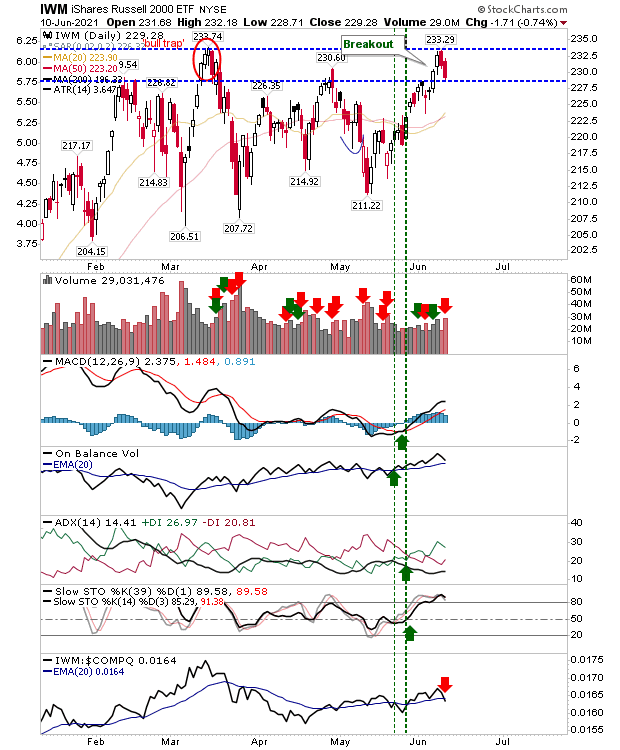
A bit of a mixed bag with the Russell 2000, having enjoyed prior strength, now finds itself in the process of back testing support - with the $229 level key.  Volume rallied to mark distribution to go with a relative underperformance to the Nasdaq.  Strength in the Russell 2000 is key for the broader averages but we need to see a bounce here if we are not to see a return to the prior trading range (of March-May).

Small Caps break from trading range

Image
There wasn't a whole lot to today's trading, but the Russell 2000 did manage to break out of its trading range on higher volume accumulation.  Technicals are net positive, including relative performance.

Rally returns losses, but resistance remains

Image
Indices enjoyed a solid Friday as buyers undid Thursday's losses.  The Nasdaq is still underneath trendline resistance, but above its 50-day MA. Technicals are mixed with the 'sell' triggers in On-Balance-Volume and ADX offset  by bullish technicals for the MACD and Stochastics.

Ironically, Dow Jones barely moves as Nasdaq gaps down

Image
I had mentioned previously how the Dow Jones Industrial Average was set up for a double top with a pair of gravestone doji, but it was the Nasdaq which lost more on the day. The Nasdaq gapped down off resistance but it remained above its 50-day MA. The MACD and Stochastics are on a trigger 'buy', with other technicals bearish - so there is a bit of a mixed bag here. The index is underperforming relative to the Russell 2000, but with the trading range still in place, any action between support and resistance is of lesser significance.

Second gravestone doji for Dow Industrials Average

Image
It was a bit of a mixed bag for the indices. The Dow Jones Industrial Average posted a second gravestone doji following the earlier one at the start of May.  The index is still above trendline support, lead moving averages (20-day, 50-day and 200-day MA) and technicals are net positive - including relative performance - but two gravestone doji at a peak are a potential concern.

Archive

Show more