Posts

Showing posts from December, 2023

Being "Right" but still losing...

Image
I'm trying the Topstep Trader Combine as a sampler to day trading and it's an interesting setup with minimal outlay costs to get started. I'm not a huge fan of their platform UI but everything else has been pretty good so far. Today was one of those days where I waiting (and waiting) for the profit taking to kick in, but by the time sellers made their appearance I had reached my loss limit for the day and so that, was that. You can see all of my whipsaw trades here. For the record, I only work off price action, looking at support/resistance and tells like rapid stop take outs, usually a good sign for a reversal.

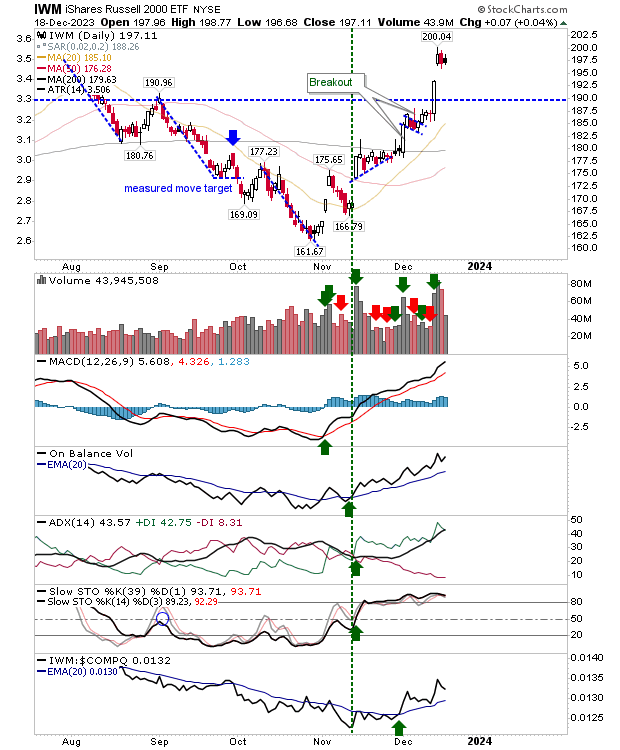
The Russell 2000 ($IWM) is ready to fill last week's gap

Image
"Black" candlesticks are rarely a good and we had one today in the Russell 2000 ($IWM). Expectation is for an open below today's close, then a close lower than the open. As part of this bearish setup I will be looking for a gap closure that may result in a bullish 'hammer', but more likely, I would look for a close inside the gap that keeps bears in control. Buying volume dropped significantly from Friday, but with the holidays fast approaching I wouldn't worry too much about volumes.

Dow breaks to new all-time highs on weekly chart

Image
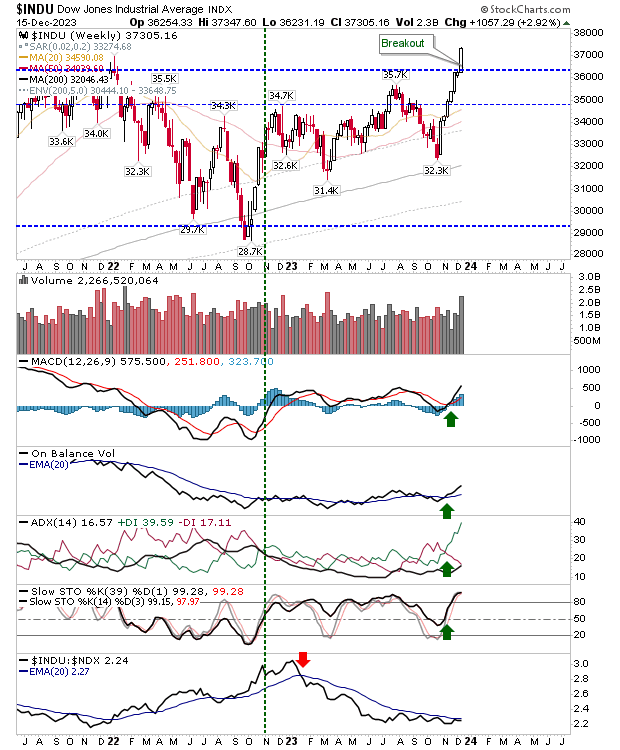
It was a classic breakout for the Dow as the index recorded a new all-time high. Weekly buying volume was the highest since January 2022. Technicals are net positive with the index shifting to a relative outperformance against the Nasdaq 100.

Russell 2000 surges on positive response to Fed.

Image
With the Fed signalling rate cuts for 2024 , it was another good day for markets, with the Russell 2000 ($IWM) cashing in on its resistance pressure with a 3%+ gain. In doing so, it easily surpassed the August swing high on higher volume accumulation.

Russell 2000 recovers intraday in preperation for upside follow through

Image
I'm doing a bit of intraday trading as part of TopStep's Trading Combine just to see how feasible day trading is. One thing I have been waiting for is the upside follow through in the Russell 2000 ($IWM). I have watched as sellers have attempted, and failed, to undercut the swing low of the 'bull flag'. I have so far managed to stay on the right side of the intraday trend, although it feels like a decent push higher is not far away. Technicals are all net postive and the index is outperforming peer indices.

Markets inch higher as Semiconductors make all the running

Image
Bulls came into the week with a small edge, but it was left to Semiconductors to push beyond its 'bull flag' and July swing high resistance. Gains in the Semiconductor index coincided with a new MACD trigger 'buy' and an acceleration in relative performance to the Nasdaq 100.

Strong finish to the week across all indices

Image
The last couple of weeks have seen the Nasdaq and S&P move to-and-fro in a consolidation trading range, digesting the gains from the October rally, but Friday's finish pushed markets out of this trading range. Friday's finish also improved the weekly timeframe charts, confirming breakouts on these timeframes.

Tight trading near highs keeps momentum bullish for indices

Image
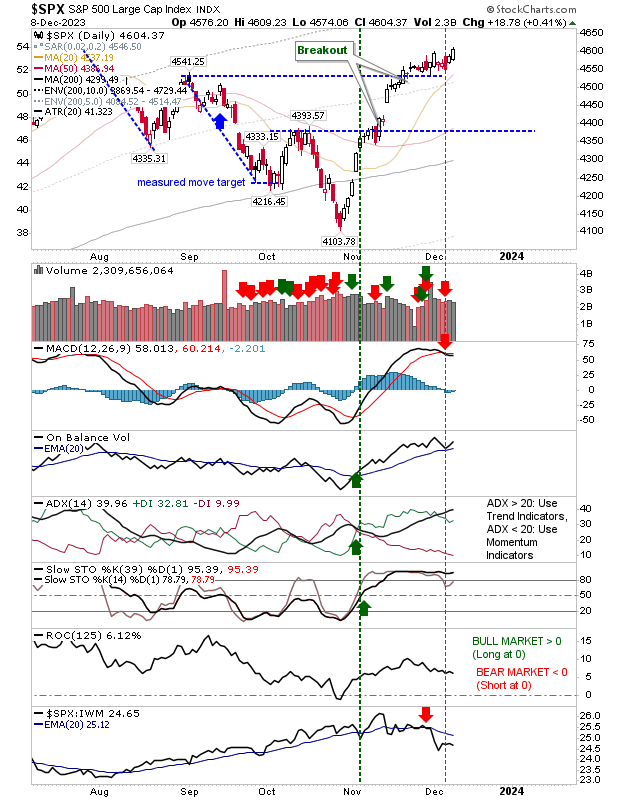
Markets are trading near resistance defined by recent swing highs, reversing eary losses. The S&P opened on resistance and posted a small gain. The Nasdaq had opened at support and has moved to trading range resistance. In process of making today's gains there was a switch in relative strength back in favor of the Tech index. There is still a MACD trigger 'sell' to negotiate, but this signal occurred well above the bullish zero line.

Russell 2000 pegged by minor resistance as Nasdaq and S&P hold breakout support

Image
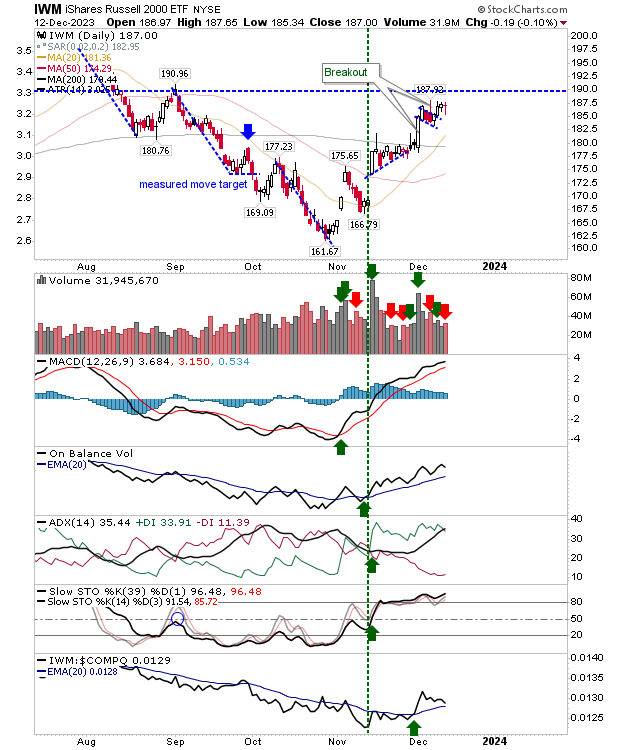
The Russell 2000 ($IWM) posted two days of strong buying that brought the index up towards minor resistance. Not surprisingly, after days of narrow action into the prior ascending bullish triangle consolidation the resulting price surge has entered a new consolidation period. Technicals for the index are strongly net bullish, but even with the loss, prices are still near highs of the last couple of days.

Russell 2000 ($IWM) smashes a breakout

Image
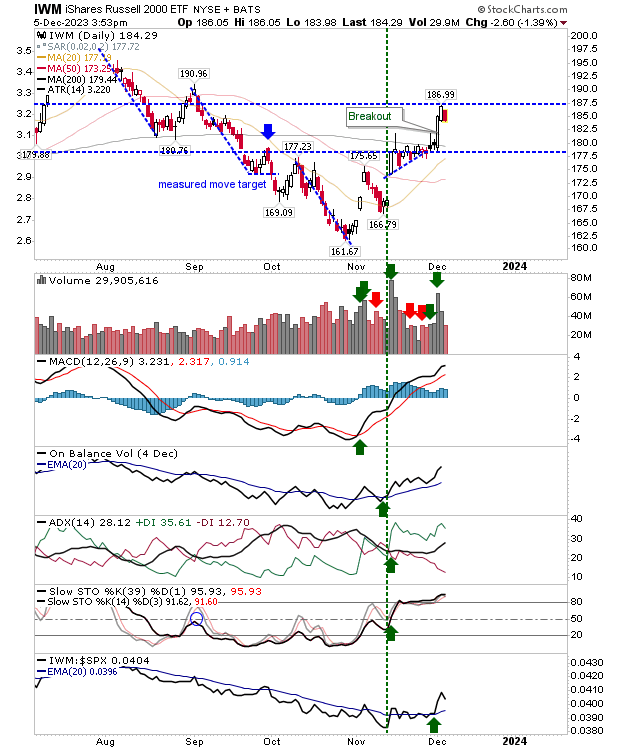
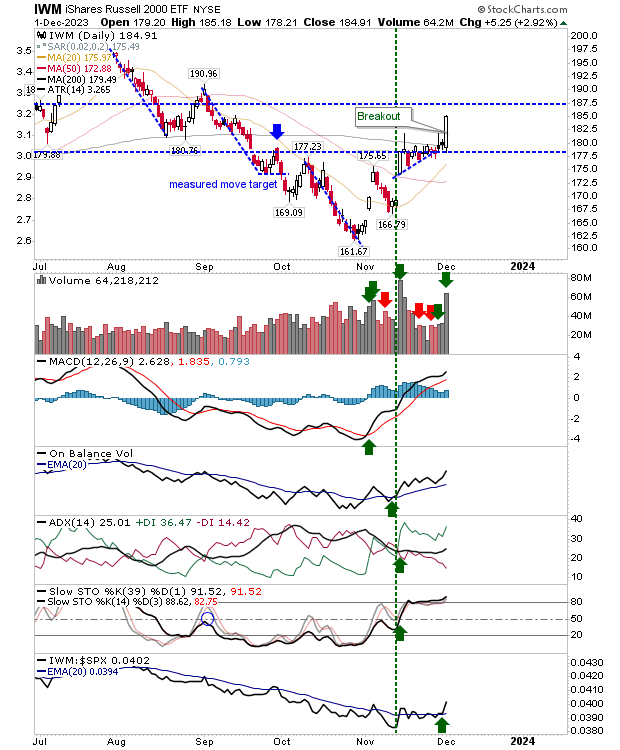
After weeks of toying with the 200-day MA, the Russell 2000 ($IWM) pushed through this moving average with ease on higher volume accumulation. Tehnicals have been net positive since the start of the bullish ascending triangle, but Friday's move has not only cleared price resistance it has also managed to accelerate relative outperformance against the S&P.

Archive

Show more