Posts

Showing posts from July, 2013

Vacation Time

On vacation until August 4th.  Available on twitter @fallondpicks.

Daily Market Commentary: Two Days of Gains

Image
Technology caught up with Small Caps as the rubber band of relative strength swung back to the Nasdaq. However, the Russell 2000 didn't disappoint with its seventh straight day of gain. The index is just 14 points away from its measured move target .

Daily Market Commentary: Gains Held. Semiconductors Recover.

Image
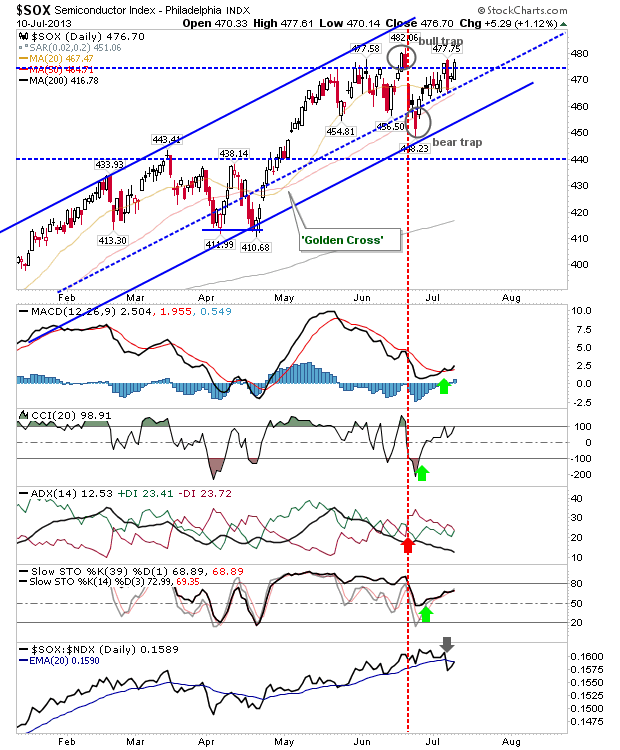
Large Caps made their move yesterday, this time, it was the turn of Tech indices to post gains. The semiconductor index hasn't quite negated the bearish engulfing pattern, but it has gone a long way to making up its loss. The 'bull trap' is a secondary level to take out. However, both bearish engulfing and 'bull trap' could be taken out Thursday.

Daily Market Commentary: Bulls Win Out But Semiconductors Remain Weak

Image
It looked like bulls and bears got something out of Tuesday's trading.  Bulls get the overall winners nod as there were fresh breakouts for the S&P, Dow, Nasdaq 100; with the Russell 2000 and Nasdaq adding to their respective breakouts. Volume rose in line with accumulation. But, semiconductors had a lackluster day despite logging a 1% recovery. The S&P finished the day with a number of support levels below it, notably the former channel support which crossed through (now defunct) resistance from May highs, with the 20-day and 50-day MAs nearby.

Daily Market Commentary: Net Bullish

Image
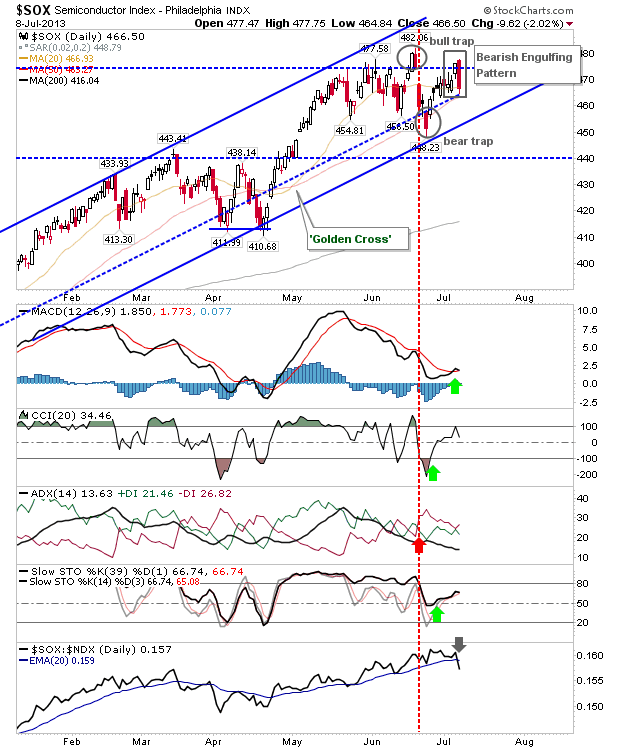
It was a modest day for the markets, with morning gaps doing most of the leg work for bulls.  However, there was enough strength in the market to break the net bearish turn in technicals for many of the indices, and all key indices are back supporting the long term bullish picture, ending the May-June decline. Pullbacks can be viewed as buying opportunities It's not all plain sailing for bulls. Resistance remains in play for certain indices and the semiconductor index posted a significant bearish engulfing pattern.  If you are a short, or looking to short, this is the index to watch on Tuesday.
Quantshare: Select Sector SPDRs: Time For The Spider Men To Change Their Webs

Image
By Azouz Gmach When it comes to portfolio diversification and sectoral investments, the nine select SPDRs (informally called spiders) based on the GICS (Global Industry Classification Standards) sectors of the S&P 500 turn out to be one of the best options for the investors. Select sector SPDRs are a group of nine sectoral ETFs managed by the State Street Global Advisors (SSgA). They are unique in the way they can be traded on the NYSE Arca throughout the market hours, have low expense ratio of 0.18 and together they represent all the ten sectors of S&P 500. Sectors that constitute the S&P 500 can be categorized into two basic groups: the cyclical and the non-cyclical sectors. The non-cyclical sectors are conservative and defensive sectors. They have usually lower volatility and steady returns. Investors flock to these sectors under gloomy market conditions. This group includes Consumer Staples, Healthcare and Utilities. The other group consists of sectors which have st

Daily Market Commentary: Holiday Pop

Image
For a shortened day, Friday was a good finish to the week. Indices closed strong, even if volume was never going to be a key decider. The S&P made it above its 50-day MA and is approaching former channel support turned resistance.

Daily Market Commentary: S&P Breakout?

Image
The S&P may have finally cleared resistance, although it was not a resounding breakout. The index edged above declining resistance, but remained below its 50-day MA. There was also a MACD trigger 'buy' to go with the gain. It's a possible long side trade with a stop below 1,601.

Daily Market Commentary: Second Rejection of Resistance in S&P

Image
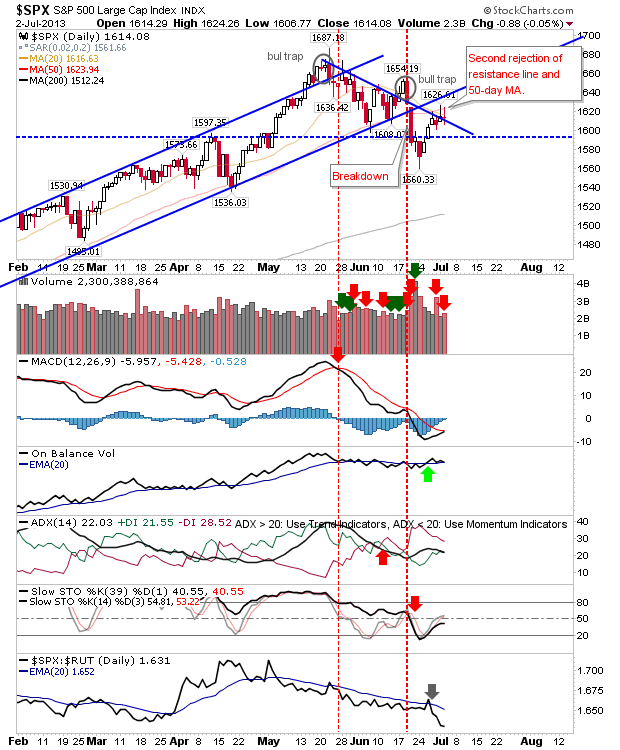
As I write this, Futures are down, but yesterday saw a second rejection of both trendline resistance and the 50-day MA for the S&P.  Volume climbed to register a distribution day, although the volume was well off the selling of Monday.

Daily Market Commentary: Mixed Blessings

Image
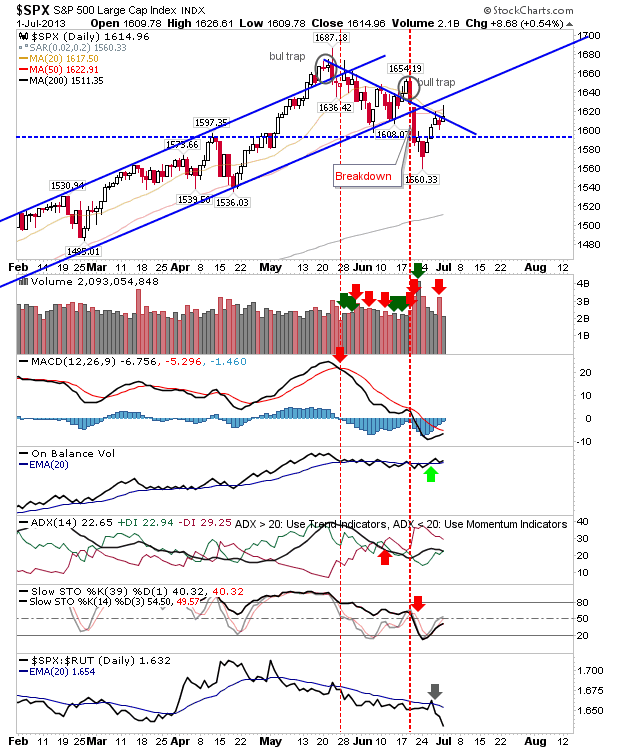
The day started by exceeding expectations. Shorts trying to fade the gap higher would have struggled, but those playing the afternoon drop may have walked away with a profit.  However, some indices finished above resistance (50-day MAs), making it a difficult play to predict for Tuesday. Today's weak finish suggests a mini-top for the 5-day rally is in place (stops on a break of today's high), with some indices offering short side opportunities. The S&P had the worst of the action. The index not only failed to hold the break above the 50-day MA, it also failed to hold its breakout. The inverse hammer offers a stop placement at today's high.

Weekly Market Commentary: Mix & Match Charts

Image
A strong week helped boost what was a torrid one before. However, it hasn't changed the larger picture of the decline from May's highs. The daily's continue to honor resistance (favouring shorts), with weeklies confirming this bearishness. But... breadth for the S&P has fallen enough to offer a long side play, although S&P Bullish Percents are still too rich for a major swing low. Nasdaq breadth metrics are attempting a swing low, but the Summation Index is suggesting "not yet".  Again, the latter is not in negative territory associated with a strong swing low.

Archive

Show more