Posts

Showing posts from April, 2008

F-day

Image
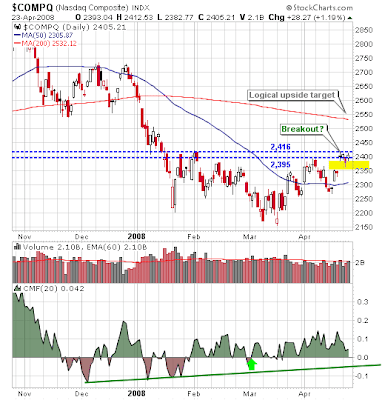
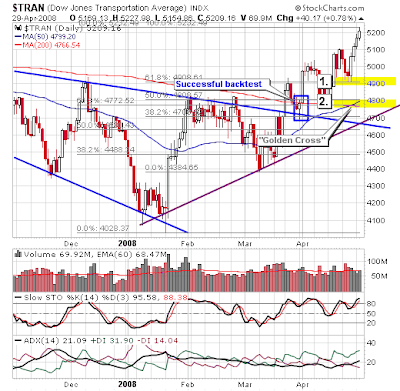
How will the market react to whatever the Fed decides to do? Because of the tight trading for the past few days the expectation will be for a sizable move one way or the other. The 200-day MAs are a logical upside target, with the 20-day and 50-day MAs lurking below. Markets have effectively traded sideways since the January bottom and it would be good for this pattern to be put to rest. The best action for the bulls comes from the Transport index (even with all the woes in the airlines). The ADX confirms a bull trend and the "Golden Cross" between the 200-day and 50-day MAs shows a long-term bullish shift. Given this, I suspect we will see higher prices over the coming weeks even if the Fed 'disappoints'. Points [1] and [2] on the chart mark likely retracement points (based on Fibonacci and support) for a negative reaction to the Fed. Get the Fallond Newsletter

Link reading

Not expecting too much for today, so took a look at what's going on my feed reader: CXO Advisory takes a look at AlphaKing: In summary, testing indicates that the AlphaKing Trading Indicator may have some value for timing the Nasdaq Composite index, but the duration of the live data sample is much too short for reliable inference. Financial Week looks at blogmining. Econoblogging as a step towards a job. Vix and More on High Implied Volatility . Wall St. Warrior always has a great pre-market warm up. Not expecting much today Herb Greenberg's five lesson's learnt. (Via Maoxian via TraderMike) Why things cost $19.95 (Via Maoxian) How to monitor websites that don't have RSS feeds - handy (Via Maoxian) Bill Rempel's Seven Quantifiable Ways to Define Trend . The Average Directional Index is my favorite. Get the Fallond Newsletter

Stockcharts.com weekly review

Image
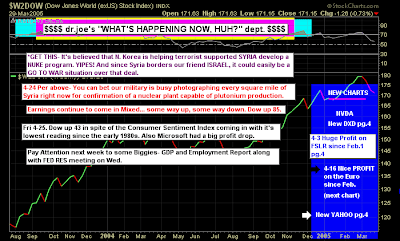
A week which has mostly passed me by with respect to the market. So what did happen? Dr. Joe is looking to nest week's figures: Dollar looks ready to make some headway north, possibly to 77-78 level: He has given the new Stockchart's charting features a go: But there looks to be a breakout in the Dow (Joe doubts it another chart - but it looks good to me). PPO looking strong: Maurice Walker is now second ranked Stockchart public list; his weekly review makes it one of the best. I like his analogy for this week: I've been following the a recent news story about John Darwin, who was a canoeist that faked his own death. He and his wife committed insurance fraud as he went into hiding in Panama. Darwin claims he had amnesia for the past five years. If he is found guilty he could face up to 10-years in prison. Darwin had been written off as dead by everyone, only to come to find that he wasn't dead after all, he was only on a short hiatus. John Darwin was alive, and so is

200-day MAs fast approaching.

Image
Bulls will have to be pleased with the last few days of action. Volume has definitely sided with them and breakout gaps for the Nasdaq and Nasdaq 100 look to be holding. The next likely stumbling block for the averages looks to be the 200-day MAs. Any weakness should relieve overbought conditions, but not enough to close those key breakout gaps. Get the Fallond Newsletter

Top-10 (9!) stock blogs

Thank you to Fiona King at CurrencyTrading.net for listing me as part of their top-9 stock blogs. Also thank you to all who have sent their respects by email. I very much appreciate the support.

Next update Thursday

Due to the death of my mother the next update will be on Thursday. Thank you.

Stockcharts.com weekly review

Image
A big push on Friday looks to have given bulls an edge. How did the Stockcharter's see it? Dr. Joe kept an eye on Oil as it continued its march ever higher. What do stochastics say here for the Dow? Will the next backtest reset support/resistance for this indicator? Considers the Nasdaq and S&P as contained by resistance: The Maurice Walker homily favors further gains: The daily DJIA got a break above its double bottom confirmation line of 12,767 on Friday. The pattern measures 1133 points having a target of 13,900. I expect the other daily index charts such as the S&P 500, the Nasdaq, and Russell 2K to follow the Dow's lead, and eventually move above their confirmation lines. Once the double bottom patterns breakout, prices will challenge the intermediate downtrends. However, the Russell 2K must break above its intermediate downtrend before it can break above the double bottom pattern. The S&P 500 rose 4.31 %, the DJIA increased 4.25 %, and the Nasdaq climbed 4.

Zignals Blog

Image
For the next couple of months (or at least until it shifts hosts) I will be writing articles for Zignals. This is a new endeavor and I will use the opportunity to publish articles relating to financial blogging and strategy development. Fallond Stock Picks will remain focused on technical aspects of the market. I hope to get my first article on a MACD strategy test on the next Festival of Stocks this coming Monday. If there are particular queries relating to the new blog then I can be reached at declan-at-zignals.com. The new blog's feed can be found here .

New KIVA loans

Image
The latest KIVA loans come courtesy of first month subscription payments from M. Siegel and J. Mercer . If you are interested in contributing please subscribe to my newsletter using the [Subscribe] button under the header. Allow 24 hours to set up site access and add your name to the email distribution list. The first loan goes to Amidu Jalloh: Amidu is 54 years old and married, with 19 children. He is an accomplished and experienced tailor, but he lacks the capital to purchase enough supplies to allow him to meet customer demand. He learned tailoring 10 years ago and has been sewing clothes ever since, especially for women in Makup Bana village. His service is very vital and saves women from travelling long distances to Makeni town to seek sewing services. Amidu would like to expand his business and is requesting a loan of approximately $700 US to purchase more cotton material, buttons, and other supplies for this purpose. The second is to Abdul Kargbo: Abdul Kargbo is 39 years old

Exponent (EXPO)

Image
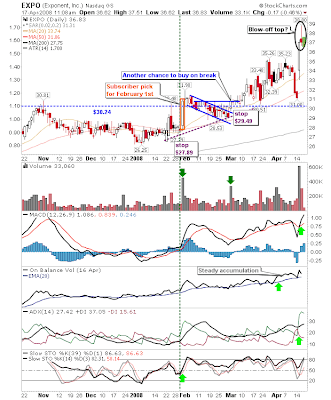
I had featured Exponent ( EXPO ) in early March . The past three days have created what looks to be a short term blow-off top and is reason enough to take some money off the table. Up 20% from March. Trade my Stock Picks at

Google Stock Screen

Image
I took the Google Stock Screener for a test drive. It's got a very plain, simple interface compared to that of MSN's Advanced screener, but lacks some of MSN's (excellent) functionality. One thing I do like about Google's is that there is a neat graphic showing the distribution of stocks across the various parameter settings. I wanted to look for stocks which were showing discounts in dividend yield. I like to be getting something back from the stock while I hold for the long term so screening using yield as a filter is a good place to start. The idea is to buy 'decent' stocks to take advantage of oversold market breath indicators when such stocks should be trading at a 'discount'. I'm not looking for the next high flyer as momentum plays tend to emerge 1-2 months after a bottom is in place and markets still appear to be feeling for that bottom. This is a scan more suited to the retirement account where capital loss tax write-offs aren't an opti

Keep an eye on those Transports

Image
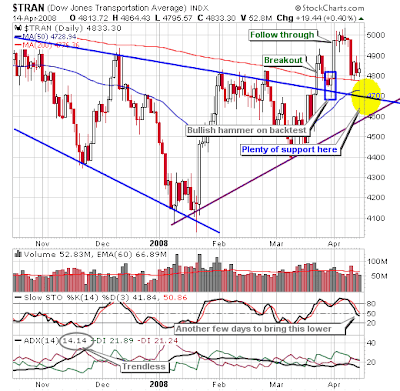
The Transport sector (and therefore the outlook for the economy as a whole) didn't have it easy over the past few days. UPS disappointment was enough to break the low volatility slumber markets had enjoyed for the best part of a week. However, the Dow Jones Transportation Average continues to hold firm at its 200-day MA with the 50-day MA on course to trigger a "Golden Cross" - a significant long term bullish signal. How this gets reflected in the Dow is more difficult to predict. The UPS related sell off brought the index back inside its triangle consolidation. There is still plenty of room for a move back to consolidation support which should be viewed as bullish - no doubt bears will see this as a confirmation of their position, but they will be wrong unless March lows break. So bulls could endure another 450 point loss in the Dow and still maintain the upper hand, especially if Transports can keep above rising trendline support connecting Jan-March lows (c4600, or

Stockcharts Weekly Review

Image
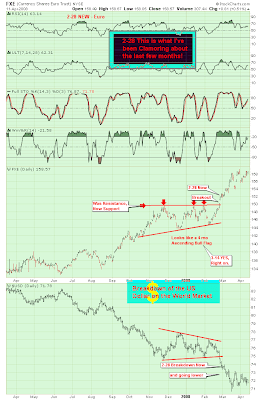
A bit late on this, but before Monday's open here is the weekly Stockcharts.com review. Dr. Joe has his Currency Shares Euro Trust (FXE) prominent. What is interesting from this chart is the consolidation in play for the Dollar / Euro Trust. Should the dollar break down it will provide a boost for Gold, hurt the market and be business as ususal. However, should the dollar counter break higher it would set the cat amongst the bear pigeons. If this was to happen look for a sharp one-day gain, and look for this to happen real soon: Joe's Dow Stochastics shows a well marked top with plenty of room before a bottom is reached: Once again - keep an eye on Health Care. It looks like May will be the month it finds it bottom: Ted Burge is watching the financials; support at $24.15 Although the point-n-figure chart has a target of $23.63 The Russell 2000 is at an interesting juncture; can 689 hold? If not, its 642 on the menu The Point-n-Figure chart clings to 760 as a target.... Mauri

Archive

Show more