Posts

Showing posts from October, 2022

Russell 2000 gets closer to 200-day MA as Friday's gains hold

Image
After Friday's strong finish there was the potential for bears to stew over the weekend and attack on Monday, and although sellers were able to do some damage - they weren't able to do more than they did at the open. Given that, the Russell 2000 was able to protect itself from the sellers and managed to make a modest gain as it looks ready to challenge its 200-day MA, perhaps as soon as tomorrow. Technicals are net bullish and relative performance has accelerated in the latter part of the month to its peers.

Another strong finish to Friday; Russell 2000 approaching 200-day MA.

Image
The volume was light on Friday, but gains were enough to negate Thursday's selling.  Markets have already recovered from the break of the loss of June's swing low, and are now looking at a challenge of 50-day MAs.  The Nasdaq is on a 'buy' trigger, but all other technicals are bearish.  Relative performance losses have accelerated, but the broader picture is more bullish, and On-Balance-Volume is close to a new 'buy' trigger. The double October swing high is still there as resistance, but a close above 11,210 would confirm a sequence of higher highs and higher lows. 

S&P breakout holds despite 'gravestone' doji

Image
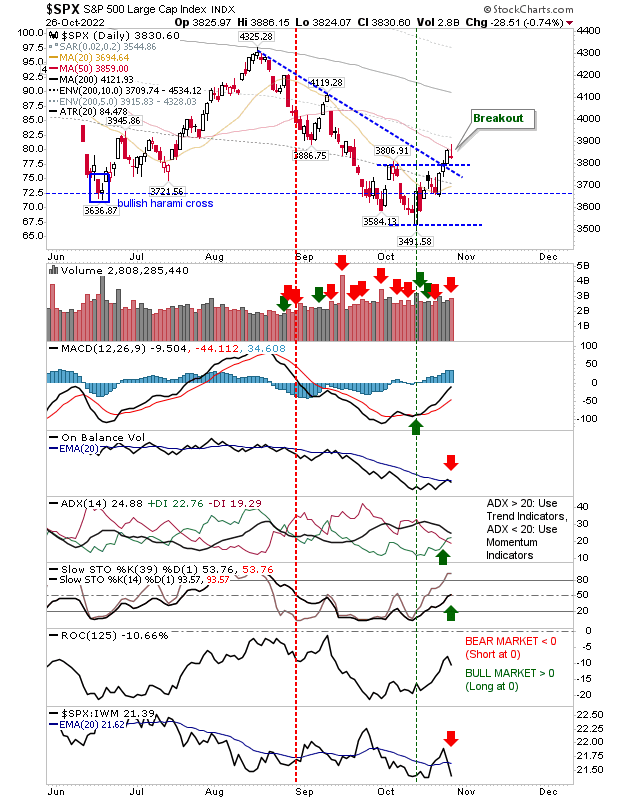
It was a mixed day. Much of what happened started positively, but by the close of business, indices were back where they started the day.  The S&P 'gravestone' doji could be considered a bearish 'harami cross', with stochastics [39,1] on the mid-line and standard [14,3] stochastics overbought. if this proves to be true (and bearish 'harami crosses' tend to be reliable reversal patterns), then tomorrow will be a down day.  Add to this, On-Balance-Volume has returned to a 'sell' trigger, with a sharp loss in relative performance to the S&P.

S&P about to break October swing high

Image
A good start to the week has indices ready to sweep past the most recent swing high from October 5th.  The first index to attempt this will be the S&P.  It's ideally positioned to make that break tomorrow, which would not only take out the swing high, but also break through declining resistance from the August high.  There is a clue as to what may happen here.

Friday's gains return challenge on Tuesday's reversal

Image
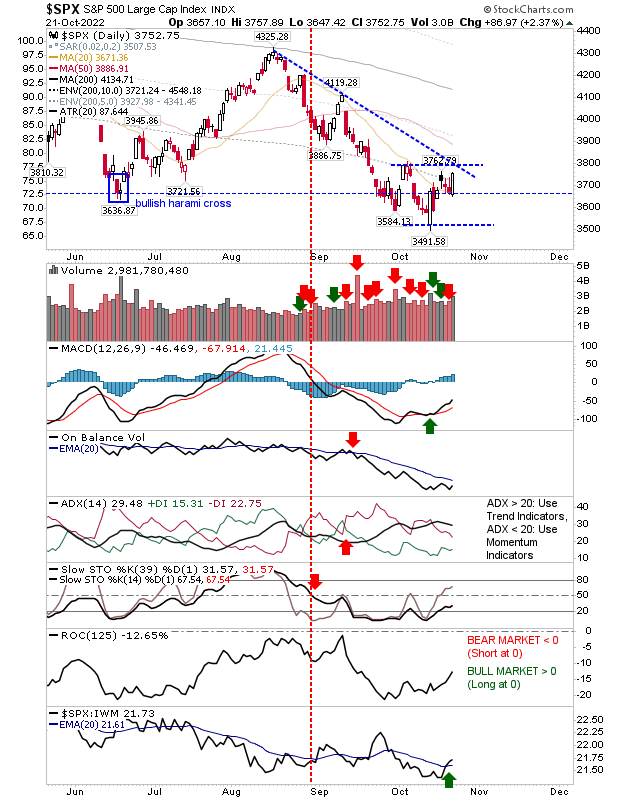
There was a solid finish on Friday across all lead indices which did much to undo the prior two days of selling and push indices into a challenge of Tuesday's topping patterns.  The accompanying higher volume was the result of options expiration, but for recent days where we have see higher volume, it has come from the buy side. The S&P was able initiate its gain from its 20-day MA, but the real fun will come if it's able to close above 3,800.  There is a MACD trigger 'buy' to work with - although it's a weak signal because it's below the bullish zero line.  Other technicals are negative, including a sharp drop in the On-Balance-Volume trend.

Russell 2000 feels the heat

Image
The Russell 2000 has been bucking the trend by enjoying a relative strength advantage over peer indices, but today was the first sign that there may be a shift away from growth stocks to more defensive large cap stocks in the near term - not the best timing given the proximity of support. Today's action generated a new 'sell' trigger in On-Balane-Volume and effectively confirmed a 'bull trap' of Tuesday's breakout.

Black candlesticks are bearish, but buyers are building an advantage

Image
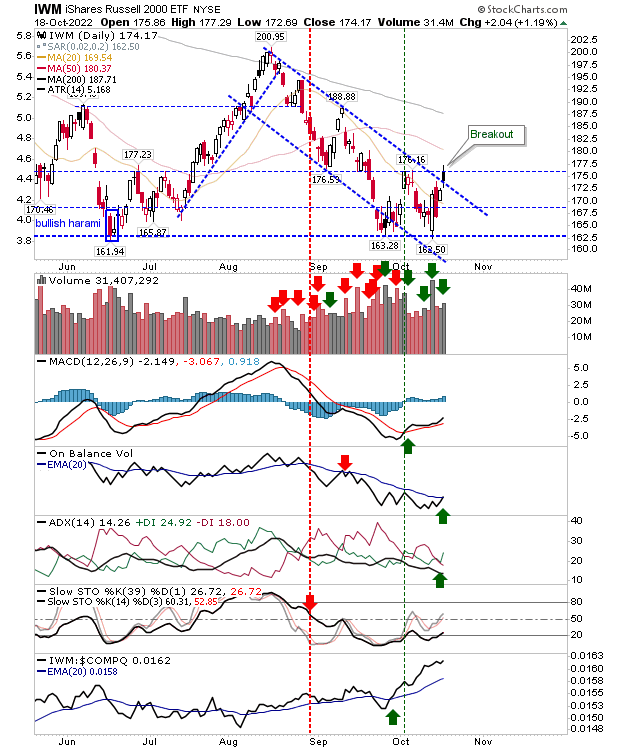
It was a day when markets closed below their open, but above yesterday's close; this set-up is typically bearish and shows as a black candlestick in a chart.  The problem is that buyers have been building a nice edge since the big bullish engulfing patterns from last week. The expectation for tomorrow is a day of selling - so if this doesn't happen then bulls can look to the rest of the week with optimism. The Russell 2000 is the index to watch.  In addition to today's gain it also managed a break from the declining channel on higher volume accumulation.  Technicals have shifted more in favor of bulls with 'buy' signals in the MACD, On-Balance-Volume and the ADX with sharp gains in relative performance to peer indices.

Selling inevitable, but Russell 2000 retains support

Image
Big bullish engulfing patterns from Thursday were going to struggle to hold their gains, particular as many had started from below support established by the June swing low, and all had come on the back of two months of selling.  With the Nasdaq, the selling had pushed down to half the height of the engulfing pattern and returned the MACD to a 'sell' trigger. Other technicals continue to worsen, but at least selling volume was down on the previous day's accumulation.

Bullish Engulfing Patterns Across Russell 2000, S&P and Nasdaq

Image
Will today be the day markets get their latest swing low?  The Russell 2000 continues to be the index to offer most for bulls as support of $162.50 held firm.  The large white candlestick was supported by strong buying volume, but if anything, today's candlestick was *too* big and is vulnerable to getting pegged back tomorrow.  Technicals in the Russell 2000 weren't vastly improved by today's buying.  The MACD still has its 'buy' trigger but didn't advance much. On-Balance-Volume has been trending down throughout September and October and today's buying, while welcome, didn't make a huge dent in that trend.  The one real positive for this index is the continued improvement in relative performance to the Nasdaq and S&P.

Lots riding on the Russell 2000

Image
After a long weekend away markets decided to undo the gains they had enjoyed in the early part of last week. It was a damaging loss, with both the Nasdaq and S&P both experiencing undercuts of support - negating what had been positive 'bear traps'. Whatever remnants of support the June lows offered for these two indices is no more, we are now looking at what the current trend (lower) from August highs can offer.  The only index to offer some level of optimism is the Russell 2000, which managed a higher close on Tuesday and is still above June lows.  No surprise to see Small Cap growth stocks surge in relative strength - not to mention, it registered as a day of accumulation.

'Bear Traps' for the Nasdaq and S&P as Russell 2000 holds above support

Image
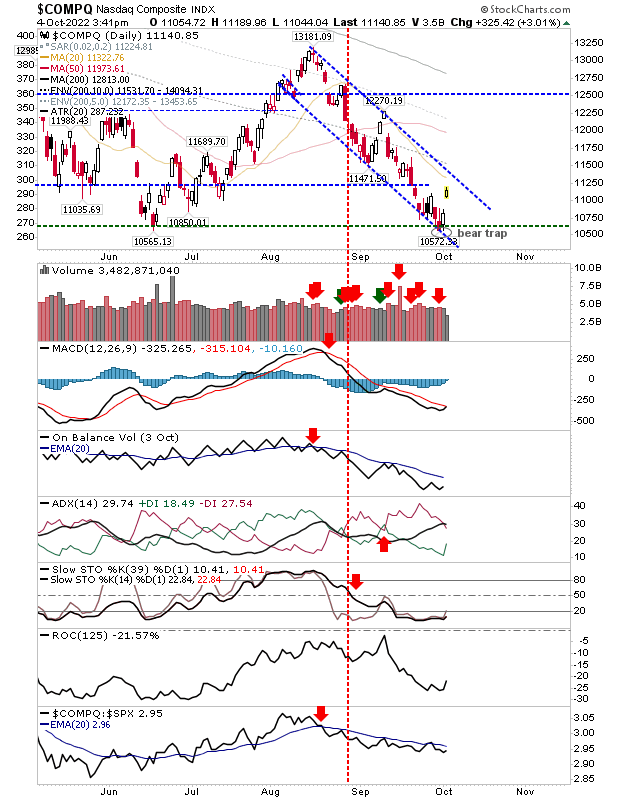
Buying in the Nasdaq and S&P delivered important 'bear traps' which in part, probably fueled today's gap highers in these indices. There is still alot of work for bulls to do, not least drive breaks of downward channels - not to mention, clear the first of the key moving averages in the 20-day. But it does give indices some respite from the grinding selling of the last couple of months.  The buying in the Nasdaq didn't register as accumulation, but there is a slow improvement in the technical picture with an upcoming 'buy' in the MACD.

Friday delivered the selling the prior weeks close suggested would occur

Image
It was going to be a tough week for markets when weekly charts were piling on the pressure.  For example, the S&P weekly chart closed with a series of red candlesticks that finished on the 200-week MA.  It's an ugly chart, but we may be in a position to see a bullish reversal; watch for a late week rally next week assuming a weak start.

Archive

Show more