Posts

Showing posts from September, 2012

Latest Trading Jobs

A few extra jobs for this week and the carryover from the previous weeks Financial Rep Trainee Quotes & Authorizations Rep Equity Options Trader Junior Trader Intern Proprietary Trader Fixed Income - Quantitative Analyst Fixed Income - Business Analyst Fixed Income - C++ Developer EM Fixed Income Sales Business Analyst - Fixed Income Senior Investment Advisor Investment Advisor Representative Investment Advisor II Entry Level Investment & Insurance Advisor - Financial Advisor Management Trainee Investment Advisor Investment Advisor, Management Trainee Financial Advisor - Investment Advisor Representative Investment Advisor Credit Risk Manager and Modeler Private Bank - Alternative Investments Group - Head of Equity Strategies Senior Equities Compliance Officer Equity Sales Trader Credit Risk Manager Portfolio Manager II Execution Trader, Fixed Income & Protected Growth Trader/Portfolio Manager High Frequency Trader / Scientist Associate - Senio

Weekly Market Commentary: Peak in 52-week Highs?

Image
I'll start with a breadth chart which has drawn up an interesting observation.  The NYSE managed to post a peak in the number of 52-week Highs which is usually a prelude to a period of weakness. This last happened in early 2010 and led to a lackluster second half of the year. The only caveat is the lack of a similar peak for the Nasdaq. Such peaks don't typically reverse a market (it was a succession of lower peaks which contributed to the market collapse in 2007), but they have marked periods of instability. Having said that, the Nasdaq is looking toppish in other breadth indicators. The Nasdaq Summation Index is more likely to mark a peak once it negatively diverges to the parent index. If this was to be the case again then the Nasdaq has probably another couple of months worth of rally-juice before it starts to ease back. Bulls should continue to look for the Russell 2000 to break higher and follow the action in Tech and Large Cap indices. Last week's action ha

Daily Market Commentary: Further Selling

Image
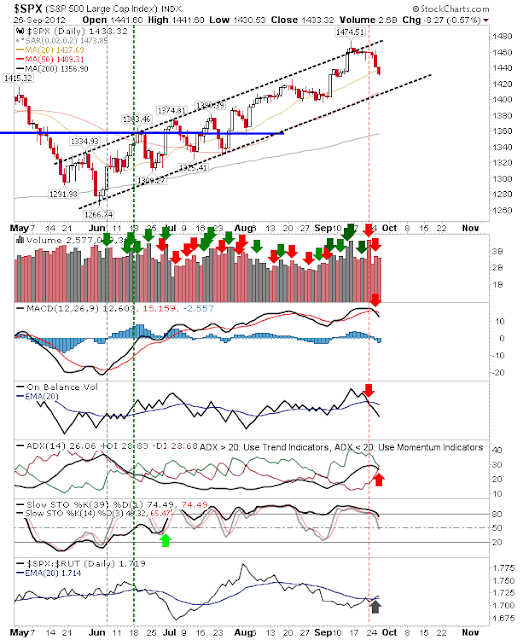
Another day of losses dropped indices below their 20-day MAs. Technical weakness intensified which confirmed breaks of support. The S&P cut below its 20-day MA with relative ease.  Channel support is next. The Nasdaq finished just shy of a test of channel support.  It will likely complete this tomorrow. The Russell 2000 also cut below its 20-day MA with next support around 825. Today's failure by bulls to defend support (20-day MAs) suggests tomorrow will see some downside follow through.  The absence of buyers is a concern, although alternative levels of support can be found at channel support and/or 50-day MAs.  The Nasdaq is likely to be the first index to test the credibility of channel and/or 50-day MA support. --- Follow Me on Twitter Dr. Declan Fallon is the Senior Market Technician and Community Director for Zignals.com . I offer a range of stock trading strategies for global markets which can be Previewed for Free with delayed trade signals.

Daily Market Commentary: Semiconductors Break

Image
Yesterday, semiconductors were knocking around 50-day MA and 390 support. Today, these gave way with relative ease - this is bad news for the Nasdaq and Nasdaq 100. The semiconductor index was already net bearish on the technical front, but there was no doubt who had control of the index today. The next support level is 374, then 350.  A relief rally will likely encounter supply at the 50-day MA. The Nasdaq retreated back to its 20-day MA, but given the damage in the semiconductor index it may struggle to hold this. The MACD trigger switched to a 'sell' to add to the selling pressure. The S&P also experienced losses, but continued to post a relative gain against Small Caps (Russell 2000). The Russell 2000 finished the weaker, ending at its 20-day MA. Technicals had already broken, but bulls have a chance of working a bounce off this moving average as they did in August. Wednesday may see a modest recovery as indices attempt to dig in at their 20-day MA

Daily Market Commentary: Weakness Prevails for Technology

Image
It was a relatively nondescript day for Large Cap Indices.  The S&P lost a handful of points, but retained a large proportion of its prior gain. In addition, it continued to gain ground relative to its more speculative Small Caps brethren. Small Caps took a slightly bigger hit than Large Caps. But losses were still relatively minor. Where the trouble lay was in the semiconductor index.  Monday's losses brought the index back too support with a net bearish turn in technicals. The index also finished on the last major moving average available for support, namely its 50-day MA. Events in the semiconductor index will heavily influence the Nasdaq and Nasdaq 100. The Nasdaq finished the day with the largest loss on a MACD trigger 'sell'.  But the index remained well above the 20-day MA despite the relative shift from Technology to Large Cap stocks.  Look for Tech weakness to expand as money rotates into more defensive sectors. The rally looks to be redirec

Latest Trading Jobs

The latest round of trading jobs are available here: Fixed Income - Quantitative Analyst Fixed Income - Business Analyst Fixed Income - C++ Developer Fixed Income Implementation Consultant EM Fixed Income Sales Desk Analyst, Fixed Income Director Fixed Income Trading Associate Trader - Fixed Income Developer - Java, Fixed Income Fixed Income Business Analyst Manager of Fixed Income Technology Business Analyst - Fixed Income Fixed Income Other jobs of interest include Senior Investment Advisor Investment Advisor Representative Investment Advisor II Investment Specialist Entry Level Investment & Insurance Advisor - Financial Advisor Management Trainee Investment Advisor Investment Advisor, Management Trainee Financial Advisor - Investment Advisor Representative Investment Advisor Credit Risk Manager and Modeler Private Bank - Alternative Investments Group - Head of Equity Strategies Senior Equities Compliance Officer VP - US Equity Finance Trader Equity

Weekly Market Commentary: Russell 2000 Ready to Break

Image
Indices continued their advance, holding the breakouts from last week.  Volume dropped as markets finished the week in the upper range of the previous week. The only index waiting to break is the Russell 2000. The Russell 2000 is finely poised to clear 868 resistance. Technicals are net bullish which favors a break of resistance. The S&P is well above resistance, turned support (1,400). The index enjoyed strong accumulation for the best part of 3 years and continues to perform. The Nasdaq has also enjoyed strong accumulation for the past 3 years.  Support is established at 3,100 and is a good place for a pull-back 'buy. Nasdaq Bullish Percents gained ground but hasn't yet reached declining resistance currently at 62.5%. The Nasdaq Summation Index also posted a weekly gain.  But it doesn't look to have reached a top given resistance usually doesn't appear until it hits 500. Only the Percentage of Nasdaq Stocks above the 50-day MA suggests

Is Pandora ($P) threatened by Apple ($AAPL)?

Image
My latest Motley Fool post is available here . Other posts are available here .

Daily Market Commentary: Recovers Losses

Image
Shorts made an aggressive move off the open, only to see their efforts clawed back by the close of business.  Bulls will need to press from here or run the risk of flat-lining - leading to drift and ultimately, lower prices. The S&P regained the mojo lost against the Russell 2000 in recent days. The index continues to run close to channel resistance.  Where volume was higher it was accompanied by buying, and the odd sell off which emerged came on lower volume. The Nasdaq did likewise, sitting just a fraction more away from channel resistance. It just about holds a relative advantage against the S&P. The Russell 2000 took the largest hit - gapping down a little - but enough to register a relative strength loss against the S&P and Nasdaq. More worryingly, it could suggest an endgame for the rally with money cycling from speculative issues to defensive Large Caps. Tomorrow will be important.  Can bulls maintain the momentum generated after this morning's w

Daily Market Commentary: Buyers Keep Control

Image
Another day where very little happened, but there was enough to suggest buyers have control of the market from the lack of sellers willing or able to move markets lower. There will likely be another step up for the indices given recent action. The Nasdaq finished the day in good technical health with higher volume accumulation. The S&P is hugging the upper channel line in tight action, off bullish technicals. The Russell 2000 probably offers the best opportunity for bulls given its relative leadership over the Nasdaq and S&P. A rinse and repeat of yesterday. The only exception is the weakening of the short side picture by the lack of any downside follow through today. --- Follow Me on Twitter Dr. Declan Fallon is the Senior Market Technician and Community Director for Zignals.com . I offer a range of stock trading strategies for global markets which can be Previewed for Free with delayed trade signals. You can also view the top-10 best trading strateg

$ISIS Ready To Make Profits?

Image
My latest Motley Fool post on ISIS Pharmaceuticals is available here . My other Motley Fool posts are available here .

Daily Market Commentary: Low Volume Small Losses

Image
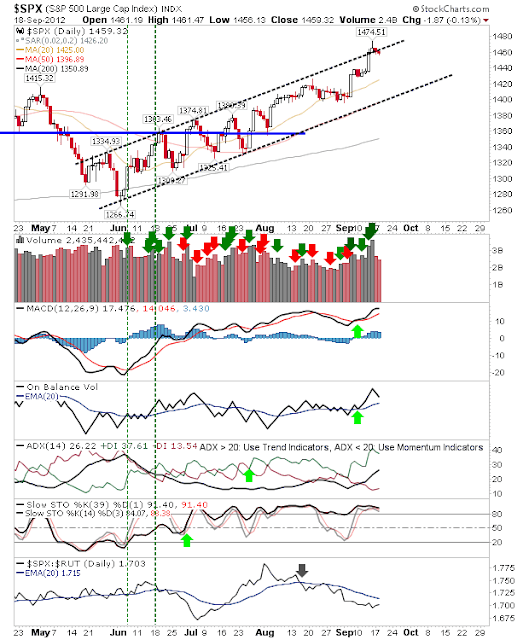
Little to add on yesterday; another day of small losses on light volume. The key aspect to the day was retaining the bulk of last week's gains. The S&P is lingering around channel resistance.  Shorts can use Friday's highs at 1,474 for stop placement and look for a move back to channel support. Technicals are still bullish, so it may take more than a day to reverse the upward trend. The Nasdaq may offer a 'cleaner' play off channel resistance.  Volume rose in line with distribution, but selling was well below last week's buying.  Again, the trend is bullish, but the short term offers shorts a little more with a stop above 3,195. Technicals very bullish The Russell 2000 has no clear daily resistance to consider; although 865 is a significant resistance level on the weekly time frame.  Bulls may wish to look to this index for upside as bull markets lead by strength in Small Caps stocks.  In relative terms, the Russell 2000 is outperforming both Large C

Daily Market Commentary: Technicals Improving

Image
Thursday and Friday of last week contributed to significant improvements in supporting technicals of indices.  The two days of gains negated any developing bearish conditions in technicals. The Nasdaq 100 was able to finish last week with a new MACD trigger 'buy' in support of an earlier 'buy' trigger in on-balance-volume.  Recent buying spikes confirmed the break of 2,795 with relative strength having moved sharply in favor of Tech over Small Caps. The Nasdaq 100 is also trading ahead of the Dow, although the relative strength switch is just recent.  However, the Dow has broken out of its (once bearish) rising wedge on huge volume. The Russell 2000 has also enjoyed accelerating gains, aided and abetted by bullish supporting technicals and a relative shift to Small Caps from Technology stocks. The lagging of Technology stocks can be seen in the semiconductor index.  Here the index is struggling to hold on to 200-day MA support. If it can crack above 410

Trading Jobs

The latest set of trading related jobs are listed here: Senior Investment Advisor Investment Advisor Representative Investment Advisor II Investment Specialist Entry Level Investment & Insurance Advisor - Financial Advisor Financial Advisor / Insurance and Investment Services Management Trainee Investment Advisor Investment Advisor, Management Trainee Financial Advisor - Investment Advisor Representative Investment Advisor Investment Advisor Credit Risk Manager and Modeler Private Bank - Alternative Investments Group - Head of Equity Strategies Senior Equities Compliance Officer VP - US Equity Finance Trader Equity Sales Trader Credit Risk Manager Portfolio Manager II Senior Relationship Manager - High Profile Firm Execution Trader, Fixed Income & Protected Growth Stock/Options Trader: Trade Firm Capital Single Stock Vol Trader Trader/Portfolio Manager High Frequency Trader / Scientist Associate - Senior Sales Trader Proprietary Equity Trader Junior

Weekly Market Commentary: Big Breadth Gains

Image
Thursday' sand Friday's gains did wonders for the weekly picture.  There were solid breakouts for the Dow and Nasdaq to follow the lead of the S&P.  For those following my Motley Fool posts we have entered a 'Profit Take' phase.  The longest consecutive time the S&P has remained 10% above its 200-day MA was 18 months over the period of 1954/55, but this may suggest the best may still yet be to come. The Dow only generated a breakout this week. The NYSE Summation Index cleared its consolidation and has room to run to resistance - this is good news for those looking for further gains in the S&P Likewise, the S&P Bullish Percents are also pointing higher. Although the Percentage of S&P Stocks is up against its maximum at 86%.  However, swing highs for this indicator rarely mark a top and only when negative divergences emerge is a warning given for a potential market top. The Nasdaq breakout was also clearcut. With 74% of

M&T Bank ($MTB) and Krispy Kreme Doughnut ($KKD)

My latest Motley Fool posts for M&T Bank ($MTB) and Krisp Kreme Doughnuts ($KKD) are now available. A feed of the most recent posts is available here .

Daily Market Commentary: Indices Remain Primed

Image
It was another day of tight action with indices holding gains made last week.  Large and Small Caps got the best of the action with the market at its high. The S&P is also nicely positioned for another push higher with no obvious resistance. The Nasdaq remains indecisive For Thursday, continue to look for further upside in Small and Large Caps. --- Follow Me on Twitter Dr. Declan Fallon is the Senior Market Technician and Community Director for Zignals.com . I offer a range of stock trading strategies for global markets which can be Previewed for Free with delayed trade signals. You can also view the top-10 best trading strategies for the US, UK, Europe and Rest-of-the-World in the Trading Strategy Marketplace Leaderboard. The Leaderboard also supports advanced search capability so you can tailor your strategies to suit your individual requirements. Zignals offers a full suite of FREE financial services including price and fundamental stock alerts , st

Daily Market Commentary: Large Caps Lead

Image
Just a brief summary of yesterday's events.  Large Caps grabbed most of the attention with the Dow finishing with a new closing high. But the gain came at the expense of Technology, with the Nasdaq and Nasdaq 100 underperforming relative to Large Caps. With a 'sell' trigger in On-Balance-Volume for the Nasdaq 100. Small Caps kept pace with Large Caps; the last three days of tight trading above last week's breakout favors another push higher. For Wednesday, look for an upside push in Small Caps, with the Dow likely to grab the media headlines (but Small Caps action is more important for the sustainability of the overall rally). --- Follow Me on Twitter Dr. Declan Fallon is the Senior Market Technician and Community Director for Zignals.com . I offer a range of stock trading strategies for global markets which can be Previewed for Free with delayed trade signals. You can also view the top-10 best trading strategies for the US, UK, Europe and

Archive

Show more