Posts

Showing posts from January, 2015

Next Post Tuesday

Image
Away for the weekend, so next post will be Tuesday. In the meantime, check out   Douglas' and Jani's  blog. --- Accepting KIVA gift certificates to help support the work on this blog. All certificates gifted are converted into loans for those who need the help more. Follow Me on Twitter Dr. Declan Fallon is the Senior Market Technician and Community Director for Zignals.com , and Product Development Manager for ActivateClients.com . You can read what others are saying about Zignals on Investimonials.com . JOIN ZIGNALS TODAY - IT'S FREE!

Bearish Engulfing Patterns

Image
Today's end-of-day losses were disguised by the relatively light declines at the close. Markets opened strong, but were unable to maintain premarket strength. The consolidations in place since the 'Santa Rally' are holding on, but markets can ill afford additional losses from here. The S&P finished on the 38.2% Fib retracement of the 'Santa Rally'. Aggressive longs may view this as a head-and-shoulder reversal; if this pr-oves to be the case then markets have to rally from the cash open. The S&P is a case in point.

Sharp Reversals on Economic News

Image
It has been a while since something other than Central Banks have moved the market. This time, it was the turn of old fashioned Durable Goods to upset the party. The loss was big, but it's still noise within the bounds of the 'Santa Rally'.  Consolidation breakouts remain in play, although volume climbed to register distribution. The S&P crossed below its 50-day MA, but it's a flatlined moving average. Technicals are mixed.

Small Caps Outperform.

Image
A good start to the week was kicked off with Small Caps adding nearly 1%. The Russell 2000 hasn't reached a point of challenging major support or resistance, but today's action cleared the 20-day MA, and accelerated the relative advance against the S&P. Technicals for the index also shifted net bullish.

Three Charts to Watch

Image
A bit of a hodgepodge of charts to review. I'll start with my favourite of the bunch: the relationship between oil and gold prices. Peaks in the relative price between these commodities have historically provided swing lows for commodities - oil in particular. Certainly, sufficient time has passed between peaks to mark a major low.

Indices Breakout - Head-and-Shoulder Reversal in S&P Negated

Image
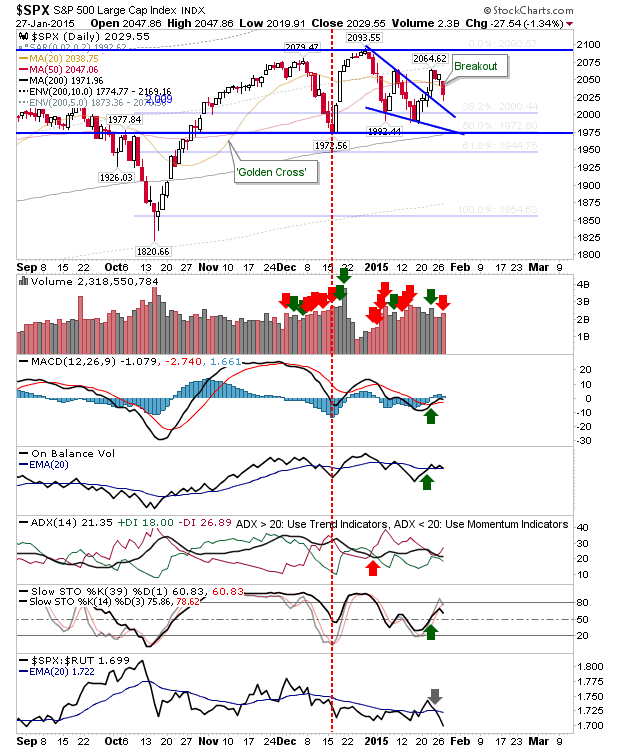
ECB action ruled Thursday's action across global markets and currency pairs. For many indices, it marked a pause in the New Year decline, but many of these same markets remain range bound by December's swing lows and the end-of-year highs. From a trend perspective, nothing has really changed. The S&P finished above a converged, yet flat-lined 20-day and 50-day MAs. There was some technical improvement with a fresh MACD 'buy', and a marked accumulation day leading to a 'buy' for On-Balance-Volume, but whipsaw risks for each of these signals remains high. Bulls would probably be best served by some tight action just below 2,100, then a break higher. It does look like the bearish head-and-shoulder reversal is done, at least in its prior form.

Semiconductor Index Phase II Breakout

Image
There were small gains, but again it was the Semiconductor Index which had the best of the action. It inked a second, modest breakout, but there is still another declining resistance level to go before it starts challenging highs. Watch for a MACD trigger 'buy'.

Semiconductor's (Very Modest) Breakout Phase I

Image
There wasn't much on offer by the close of business as early losses were returned by the close. The Semiconductor Index may have had the best of the action, although the relative gain was small. The index crept over declining resistance, but has another resistance level to challenge soon. Support at 659 remains in play, but if it breaks it becomes a shorting opportunity.

Big Gains on Modest Volume

Image
After the sequence of selling, it was no surprise to see Bulls make a comeback. Friday's volume was relatively light compared to the day's gains, but some indices are well positioned for a further advance. Best of which is possibly the Semiconductor Index. The index rallied from converged trendline and breakout support. Buyers can use Friday's low as the risk level for a bounce. There are a few declining trendlines to break, but if these go then a retest of 704 is next; first trendline will see a test on Monday's open.

Neckline Breakdown in S&P

Image
Selling returned for another day as the rising neckline connecting December and January swing lows in the S&P broke lower. Volume climbed to register a distribution day, continuing a sequence of increased volume selling. The December swing low is the next level of support and is looking like a required test.

Decent Afternoon Recovery in S&P

Image
It was looking tough for a while, but markets managed to claw back early afternoon losses. Bulls will be happy to see late afternoon buying which has the chance to follow through on Thursday morning (or premarket). The S&P returned to neckline support, although troubles are likely to re-emerge when it gets back to 2,064. It's not a particularly attractive long here, but shorts will have been repelled for a while. There is chance of a double bottom, which will require a break of the 2,060 neckline to confirm. Note that any such break would also negate the bearish head-and-shoulder reversal

Wild Ride...But No Winner

Image
Markets went one way, then the other, but in the end it was only a small loss. Volume climbed to register a distribution day, and technicals for indices gave up whatever residual bullishness there was, but price support remains in play. The S&P tagged the rising trendline, but finished below the 20-day MA. The wide range day makes it more difficult to offer guidance for tomorrow, although edging towards the bear side is probably the more likely outcome - but given the events of today, anything is possible!

Selling Continues

Image
The bearish head-and-shoulder pattern for Large Cap indices continued to remain in play after Monday's action. The 50-day MA is no longer support for the S&P as the angled neckline next comes into play. Angled necklines do not make for reliable head-and-shoulder patterns, so caution is advised.

Head-and-Shoulder (Bearish) Reversal Risk

Image
Friday's selling raises the possibility of a head-and-shoulder reversal in the S&P and Dow. Shorts are likely to use Friday's high to measure risk for such a possibility. Bulls can look to Friday's low volume as a measure of weak bullish strength, and the successful defense of the 50-day MA. A move to angled neckline support looks likely for the coming week.

S&P Rallies Past 38% retracement

Image
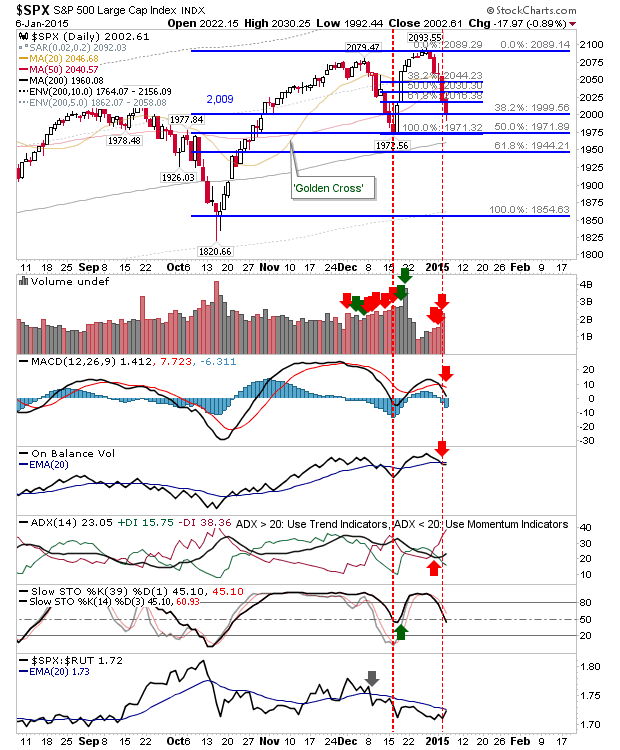
Well, I got this one wrong. I didn't think the S&P had the juice to put in the day that it did, although volume was perhaps a little disappointing. Volume did enough to register an accumulation day, although buying volume was well down on previous selling volume. In terms of technicals, only On-Balance-Volume generated a 'buy' trigger. All other technicals remain bearish. However, I still don't like this rally, but it must be respected (for now). Because of degree of comeback, a move to 2,087 is favoured, but given the retest of 1,971 failed after the New Year decline, then a test of 2,087 has a high chance of failing too. Most likely long term outcome is a trading range between 2,087 and 1,971.

Unconvincing Recovery

Image
A gap higher at the start of business didn't lead to any big gains, but it did manage to put some distance on yesterday's lows. Given the risk:reward potential it's probably not a great 'buy' here, but if a higher low can be posted it will give bulls something to work with. A gap higher tomorrow could allow buyers set a stop on a loss of today's lows.

S&P Experienced Overselling

Image
Those looking for a pullback from the December-January rally in the S&P are now looking at a Fib overshoot. The loss of the 61.8% level typically means a retracement of the entire move, which in this case is a test of 1,971.32. If this does indeed happen it will set up a possible head-and-shoulder reversal, involving a rally back to 2,079 and then a move back to 1,971 - and below.  However, first step is to see a test of 1,971.

Back in the Saddle for 2015

Image
Another year rolls in as the secular bull market continues its march. We have seen some modest selling, although there has been little in the way of volume to back it up.  The S&P is sitting on its 20-day MA having closed Friday on an indecisive 'spinning top' doji.

Archive

Show more