Posts

Showing posts from March, 2019

Large Caps recover as Small Caps run into resistance at 20-day MA

Image
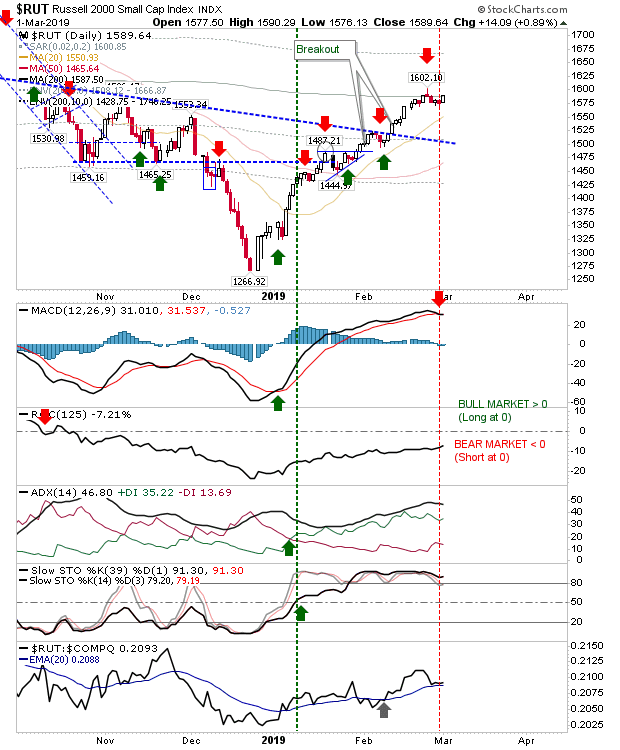
Friday offered Large Caps a little boost which helped generate a breakout in the Dow Jones Index. Small Caps were not as lucky as the 20-day MA turned into resistance. The Nasdaq bounced off its 20-day MA in what looks to be favoring the bullish picture. Large Caps, led by the Dow Jones Index, broke from the consolidation pattern. Volume rose in accumulation and the MACD is on the verge of a new 'buy' trigger above the bullish zero line.

Small Losses Keep Back Recovery

Image
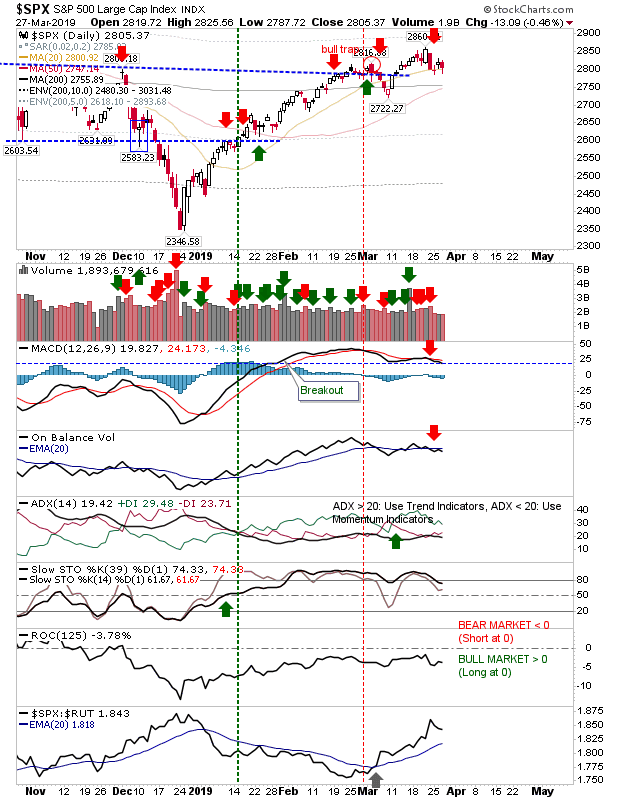
Today was unable to build on the nascent two day bounce, losing ground and pushing in on Monday's lows. The S&P is trading back at its 20-day MA with 'sell' triggers in the MACD and On-Balance-Volume. Not surprisingly, relative performance has pulled back but is still well ahead of its peers.

Bull Traps confirmed for Nasdaq 100 and Semiconductor Index

Image
Semiconductors confirmed a 'bull trap' as it failed to reverse Friday's losses. The index hasn't yet managed an initial test of 20-day MA support but technicals have started to turn bearish with the CCI 'sell' trigger. The MACD looks likely to switch to a 'sell' trigger in the next couple of days.

Russell 2000 biggest loser on Friday.

Image
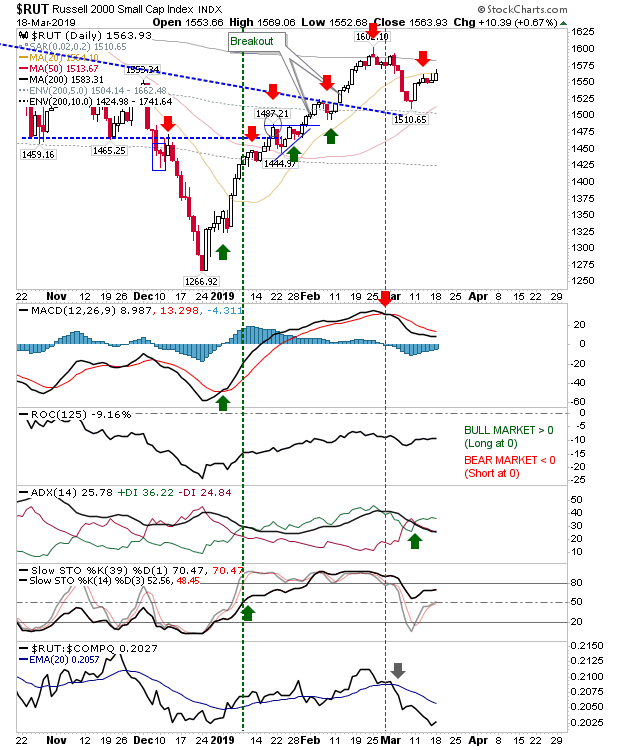
The Russell 2000 was unable to make it past its 20-day MA as it reversed through its 50-day MA. The loss didn't make a huge technical difference as relative performance was already falling off a cliff, the MACD was already on a 'sell' trigger, and only -DI/+DI switched to a new 'sell' trigger. The next target is 1,444 which was the last swing low in January.  Bulls will need to do a lot of convincing if this is to get near its 200-day MA anytime soon, so I would be looking for this bearish scenario to spread to other indices

Russell 2000 remains below its 20-day MA

Image
The Russell 2000 experienced the second day of losses in a row as the 20-day MA remained as resistance. Relative performance accelerated lower as money rotates out of Small Caps to Large Caps and Tech stocks.

Nasdaq 100 at resistance? Russell 2000 pushes against 20-day MA

Image
Another day of small gains keeps the rally moving for another day. The Russell 2000 probably got the most out of today as the index closed at its 20-day MA and is now in a position to negate prior spike high tags of the latter moving average. If there was a short play on the initial tag of the 20-day MA it looks done now. The MACD is in recovery mode but is on course to trigger a 'buy'.

Semiconductors enjoy biggest gain

Image
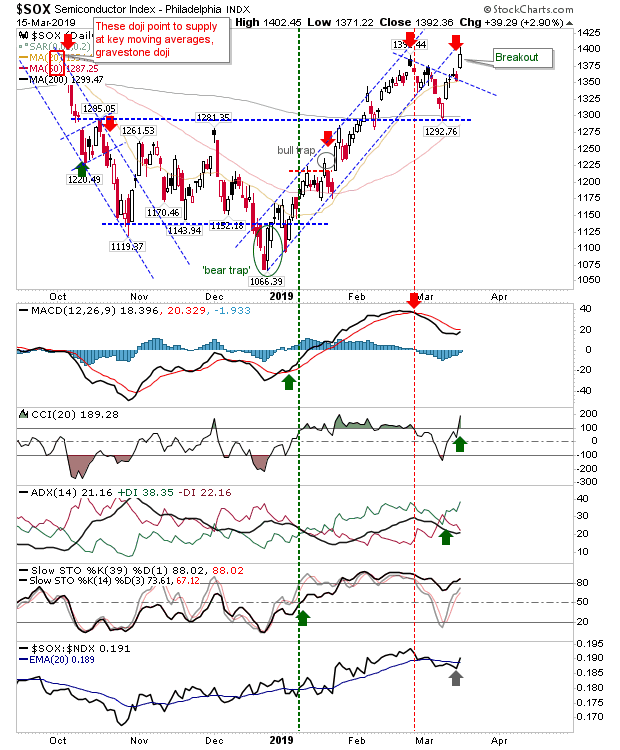
There wasn't a whole to Friday's action but Semiconductors did enough to negate the two potential short plays on offer as it managed a new closing high for the December - March rally. Semiconductors enjoyed a relative performance gain against the Nasdaq 100 which should ultimately help the latter index (and the Nasdaq). The CCI returned to bullish territory but the MACD is going to need a couple more days of gain to switch 'bullish'.

Russell 2000 and Semiconductors struggle (a little)

Image
There wasn't a whole lot to today's action. Weakest of the indices, the Russell 2000, may be offering shorts a second bite of the cherry following a rebuff off the 20-day MA, but it was not a decisive reversal.  Semiconductors have so far failed to challenge the February high and this weakness may make its way into the Nasdaq and Nasdaq 100 which are faring slightly better. The S&P (along with the Dow) had a quiet day. A very narrow doji following yesterday's 6-month high keeps the rally going and the 200-day MA is there to lend support.

Monday's gains consolidated

Image
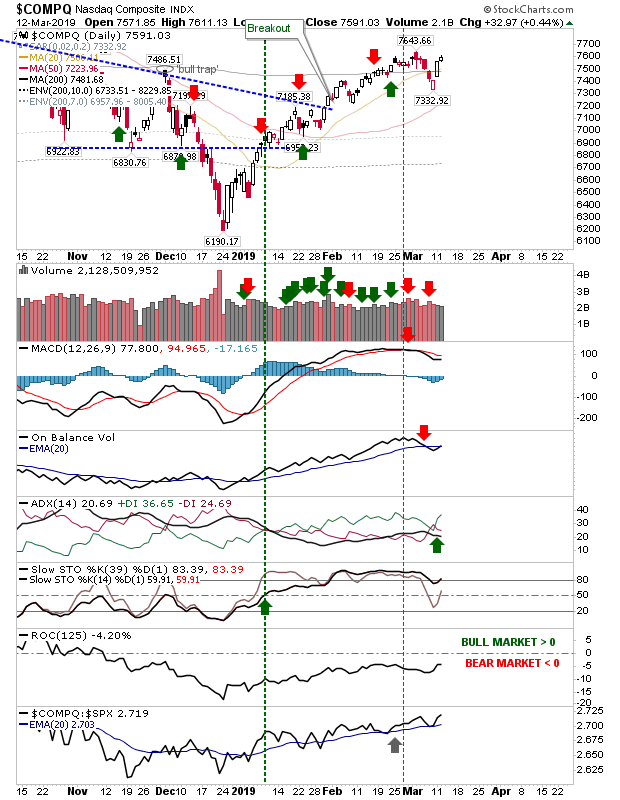
There wasn't a whole lot to add to today's action but the best thing that could be said was that yesterday's gains held. The Nasdaq added near 0.5% as prior 'sell' triggers began to reverse; first was +DI/-DI.  However, On-Balance-Volume and the MACD are still on 'sell' triggers. Relative performance has also managed a new multi-month high, perhaps enough to help break the 7,643 high.

Semiconductors at support

Image
The Semiconductor Index made a support test at converged 200-day MA and horizontal support of 1,295. Technicals for the Semiconductor Index have a bearish MACD trigger 'sell', CCI and ADX bearish cross in the +DI/-DI.  Intermediate term stochastics [14,3] are oversold and in a position to mark a new 'buy' trigger.

Russell 2000 and Semiconductors Crack

Image
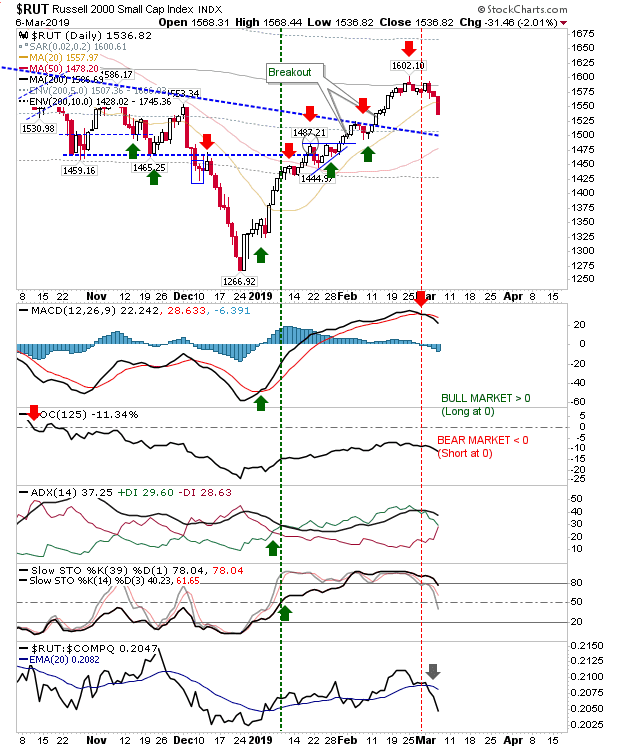
The Russell 2000 lost over 2% as it undercut the 20-day MA in a move which could pull the other indices down with it. The ROC is well below the mid-line and the -DI is on the verge of a bearish cross with its +DI following the earlier lead of the MACD.

Intraday action widens as sellers make appearance

Image
It was a day when the tight trading of recent days started to widen (in favour of sellers). The Russell 2000 reversed Friday's gain as the 200-day MA became a more substantial resistance level.  Relative performance against the Nasdaq ticked lower as the index edges towards a new phase of weakness. The marked short trade is still in play with the MACD trigger line acting as a lead indicator to the trade.

Markets advance in low key gains

Image
There wasn't a whole lot to Friday's action but the main thing was an advance against the tentative weakness which shaped up last week. Best of the action was the Russell 2000 as it gained nearly 1% to bring it back to its 200-day MA  Monday could be a critical for the index; look for a push above this moving average to follow the lead of peer indices. The index is also enjoying a relative performance advantage against the Nasdaq and S&P; so if money is going to flow into an index it's going to be the Russell 2000.

Archive

Show more