Posts

Showing posts from May, 2015

Indices Back At Support

Image
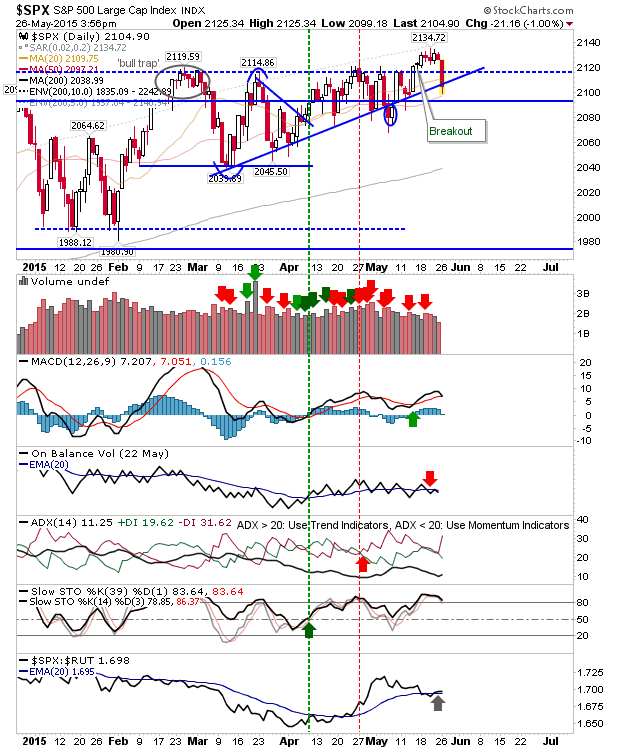
In a break from tradition, instead of the typical Friday gain we instead got another round of selling; negating the bullish setup from Thursday. To add insult to injury, volume climbed to register distribution. The S&P finished on the rising trendline, but just below 20-day MA. Technicals show bearish MACD, On-Balance-Volume, and ADX trend.  The 50-day MA could be the last chance saloon for a breakdown.

Markets Recover Losses

Image
Today's late recovery returned initiative to bulls. The Nasdaq finely placed to challenge new highs, helped by the major breakout in the Semiconductor Index; an important economic barometer.

Best Trader on eToro?

Image
Going by their current +eToro    Trending Investors , there is a familiar avatar at the top: While U.S. Investors can't copy me, my posts can be followed here .

Profit Taking Sweeps Into Town

Image
After days of tight trading, bulls decided to take money off the table following a slew of economic data. The S&P finished at rising support after tagging the 50-day MA. Today's selling hasn't totally reversed the rally, but another day like today would seed enough doubts in bulls to restrict dip buying.

Tight Trading Covered Last Weeks Action

Image
Friday didn't bring a flourish of buying or selling into the long weekend, so it's up to Tuesday to price in weekend news. Opportunities are available for both bulls and bears. Bulls will be looking to the S&P to push from 5-day days of tight, sideways pattern in an effort to put some distance to 2120. Technicals are mixed, with a strong 'buy' in the MACD and bullish momentum, offset by a 'sell' trigger in On-Balance-Volume and some mixed action in the ADX. One point of note is the bullish cross in relative performance against the Russell 2000.

Memorial Day Offer: Tradercast

Image
I have been working with Tradercast for just over 6 months, and do the Friday show from 13:30 GMT to 15:30 GMT (8:30 AM ET to 10:30 AM ET). Tradercast is operated by @PhillipKonchar , and covers Major FX pairs, European and U.S. Indices, precious metals and oil. There is some stock coverage, although the focus is on the aforementioned assets. To celebrate Memorial weekend, Tradercast is offering a special discount on membership, equivalent to a free month of service on top of the 14-day free trial. When signing up, enter the promo code " fallond_Memorial " to avail of this offer. Tradercast includes: Full charting with annotations, indicators and templates Heatmap Stocktwits feed integration Custom watchlists Video reports and archived broadcasts Economic Calendar Signals feed Education modules on trading and technical analysis Multi-chart view Community charts Real-time community chat and one-to-one messaging A sample broadcast of mine is available after

eToro Review

Image
763 followers 76 copiers A solid jump in both followers and copiers from the start of the month . This was in large part to my top-10 ranking in their People  screener.

Markets Add To Gains

Image
After yesterday's FOMC minutes there wasn't a follow through to the end of day selling.  Buyers were able to control the day's action with a return to highs. The S&P shaped a handle well above 2115 support, and is again in the process of outperforming the Russell 2000.

Market Indecision

Image
A day of whipsaw for the markets with the FOMC Minutes not pushing the market in a decisive move one way or the other. The S&P is holding its breakout, and sticking above 2115 support, although it lost further ground against the Russell 2000.

Minor Losses But Distribution Returns

Image
The S&P dropped just over a point, but finished above 2119 support. Today's action holds the gain and remains in bullish mode. Technicals are bullish, although the relative performance against the Russell 2000 has dropped off markedly, which is better for the broader rally, even if bad for the S&P in the near term.

Week Starts Brightly

Image
With the weekend behind us traders had a chance to digest last week's gains, and the decision was to keep on going. The Russell 2000 had the best of the action with a 1% gain. The index cleared both 20- and 50-day MAs with resistance up around 1,268 and a chance to challenge the 'bull trap'.

S&P Breakout Holds

Image
Friday's action was good for what didn't happen. Trading was muted, with action trading inside very narrow ranges, different to what had happened the day before. The S&P probably came out the best of it as Friday's action held Thursday's break of 2115.  Watch Monday's premarket action closely. Assuming no damage in the Europe or Asian session there is a good chance bulls could be let off the shackles. Ideally, one would want an open above 2115 to set the tone.

Breakout in S&P and Russell 2000

Image
Is this the breakout markets have been waiting for? Both the S&P and Russell 2000 edged past resistance and the Nasdaq has managed to climb above 5,000, although it's a few days from challenging the high. The S&P needs to follow through higher (very) soon to put this consolidation from February to bed.

Range Bound Trading

Image
Yesterday's recovery followed with further highs, but then buyers went AWOL and things settled back to the day's lows. Rinse and Repeat. The S&P has nestled itself against rising trendline support as today's action registered as confirmed distribution.  Tomorrow, bears will be seeing if they can break the trendline, but I won't be holding my breath.

Afternoon Surge Claws Back Morning Losses

Image
It was looking ugly for indices at the open, but by the close of business much of the day's declines had been reclaimed. For the S&P, the break of the rising trendline (and 50-day MA) was looking all but certain when sellers hit the index hard in pre-market trading, but Tuesday's finish does give bulls something to work with for Wednesday. Whether they can do anything about it is another matter. On the bright side, selling volume was down on Monday's buying; this kept the 'buy' trigger in On-Balance-Volume intact.

Lack of Follow Through for Markets

Image
After Friday's gains in the Dow there was an opportunity for other indices to follow suit, but buyers suffered a bout of shyness. Tech and Small Caps finished the day near their lows after handing back early gains. For the Russell 2000, the day finished with an inverse hammer just below its 50-day MA (which is about to 'death cross' with its 20-day MA). The inverse hammer followed Thursday's indecisive doji, leaving the gap vulnerable to a fill tomorrow. A new downward channel may be emerging here and needs to be monitored.

Dow Base Breakout

Image
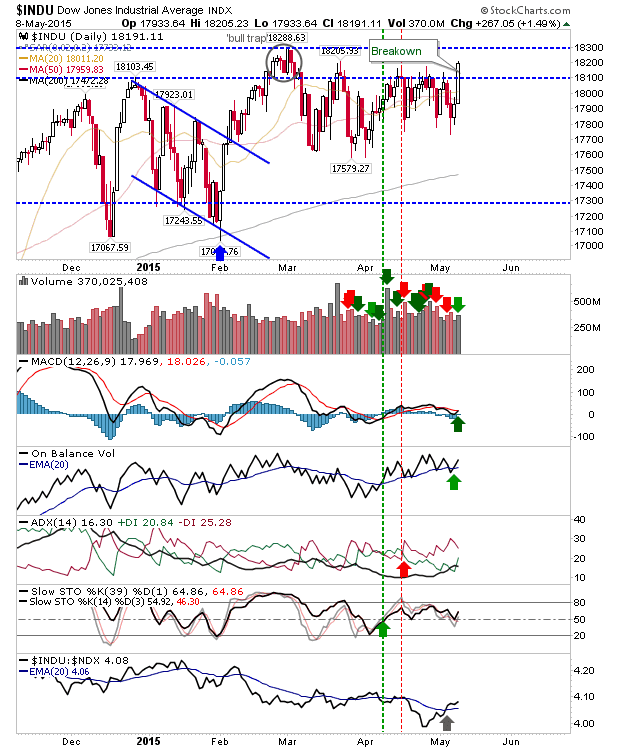
Star of Friday was the Dow Jones Industrial Average as it cleared congestion dating back to March, although there is still the 'bull trap' from February to clear. Volume climbed to register as accumulation, and it came with a MACD trigger 'buy' and On-Balance-Volume 'buy' trigger.

Riding Support in S&P, But Nasdaq Breaks

Image
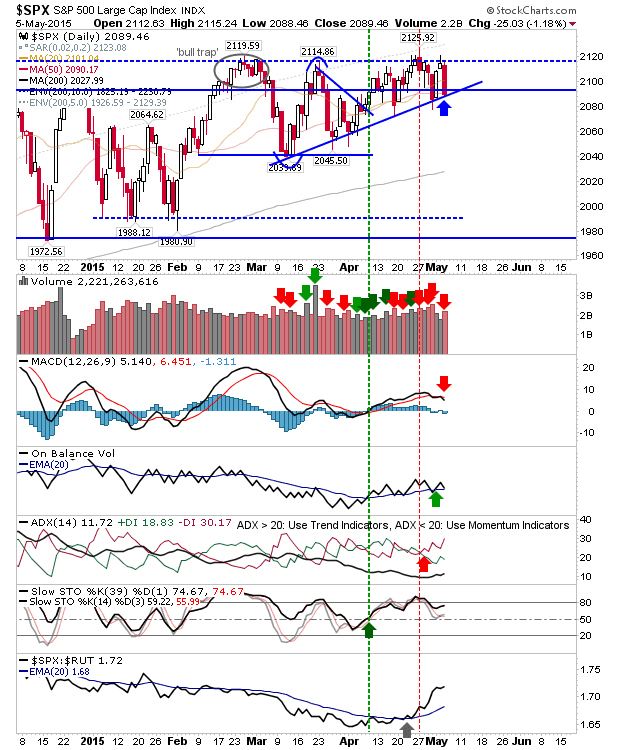
Sellers took control of markets with the Nasdaq following prior weakness in the Russell 2000 with a breakdown. This just left the S&P trading at support with very little room for maneuver if bulls don't make an appearance tomorrow. Volume climbed in confirmed distribution and there was a 'sell' trigger in the MACD.

Promising Start Gives Way To Late Selling

Image
It was a bit of a non-event for indices as early gains were unable to hold by the close of business. As a result, some of the challenges on highs faded and all indices remained inside prior consolidations. Volume was also down on Friday's, which kept things muted.  For example, the S&P touched on 2120 resistance, but finished below this level.

Reverse of Thursday's Losses

Image
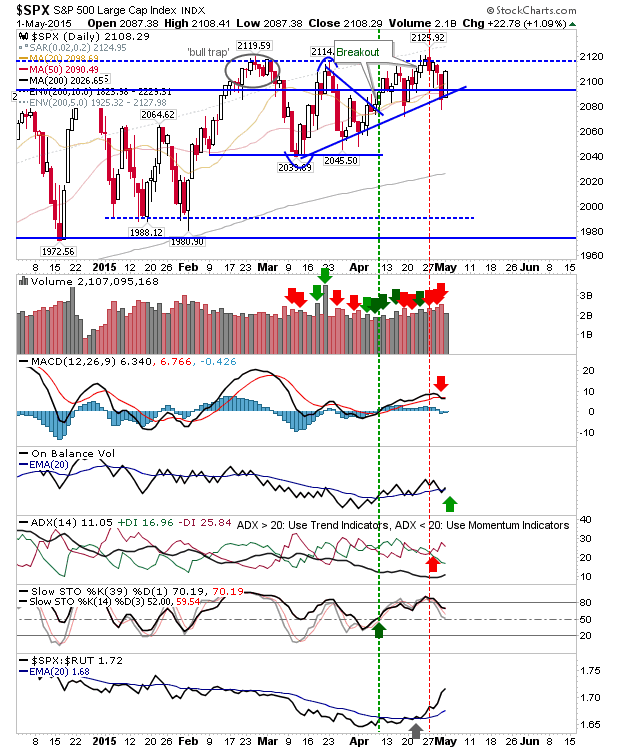
It was another day of to-and-fro for the markets, this time indices regained the ground they lost on Thursday. Although Friday's buying volume was lighter than Thursday's selling. The S&P had a mix of positive and negative technicals: 'sell' triggers in the MACD and +DI/-DI were countered by a 'buy' trigger in On-Balance-Volume. However, since February the only important levels of note are 2,120 resistance and rising trendline support - until these break market action is just noise.

eToro Review

Image
440 followers 33 Copiers I'm about 2 months into my eToro experiment. Basically, it's an opportunity to test trading strategies in a live market environment without exposing myself to large capital losses.  What I like is the selection of leverage choices (most of my trades use x5 to x10 leverage, stocks are x1) and the low initial sums which can be risked; for example, you could make a $10 bet on the S&P at x 5 leverage. You can of course risk (much) more and leverage higher, but that is not the purpose of this account for me. Those of you outside of the U.S. can also automatically follow my trades if they wish by copying my account . My performance stats are okay, although I should add, the performance from 2013 to Feb 2015 was down to Apple stock alone! My active trade management covers March and April. As I have intended, my trade risk is low, scoring 4 out of 10 (lower score => lower risk per trade). And since taking over the active management of the

Archive

Show more