Posts

Showing posts from December, 2013

Market Sentiment: Sector Breadth Divided
Image
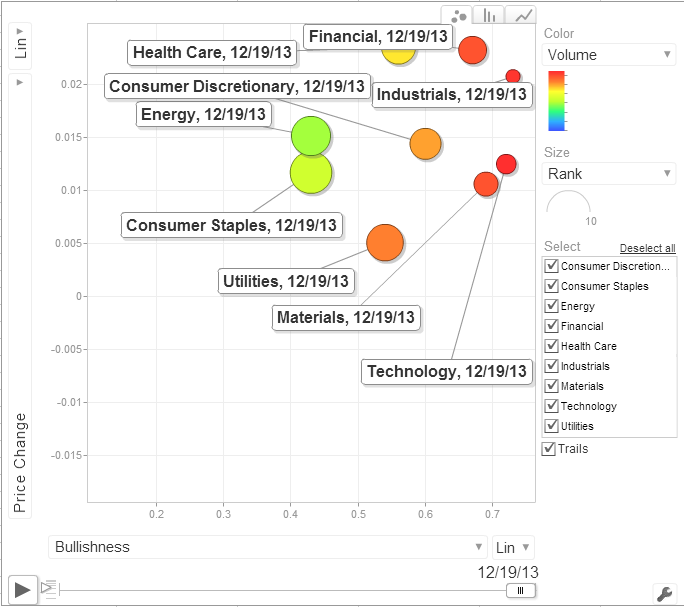
Well, after last week's possible  short suggestion on Industrials , one has to go back to the drawing board. Friday's snapshot covered the prior two days, which offered largest price gains for Financials and Health Care, but it's Industrials which are the most bullish (x-axis), and experiencing the strongest accumulation (red color intensity for volume). The other two sectors showing good volume hot zones on strong bullishness are Technology and Materials.

Daily Market Commentary: Upside Follow Through

Image
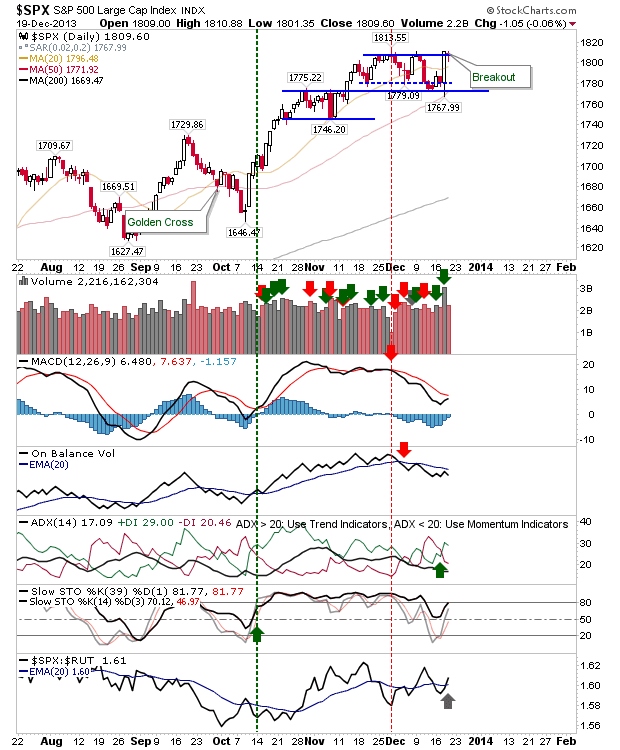
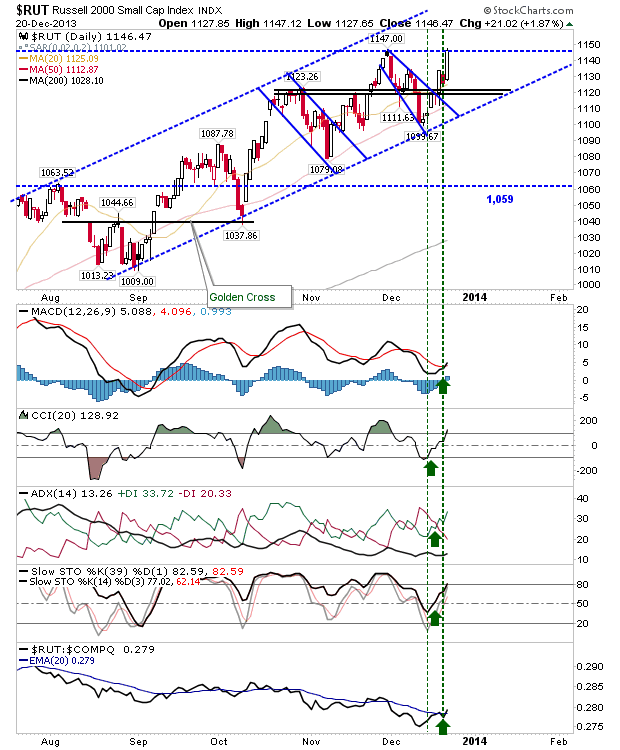
Markets got a second wind following improved economic activity.  Volume climbed to the highest since June, no doubt a surprise for those traders expecting a quiet Christmas period.  Better still, it was a good day for Small Caps, which missed out a little on the Fed bonanza. The gain was good enough to reverse the net bearish turn in technicals, and swung relative strength back again in favour of Small Caps; although this has trended against Small Caps since the end of October relative to the Nasdaq.

Daily Market Commentary: The Dust Settles

Image
After Wednesday's turmoil, from breakdowns to breakouts, Thursday proved to be a quiet affair. If - as is likely to happen - the next few days stay quiet, then there could be a low risk long opportunity to take into the early part of 2014. Wednesday's action would have rewarded traders looking at 50-day MAs: to cover shorts, and/or switch long side. The S&P having played to this nicely. Over the next few days, look for a fresh MACD trigger 'buy'

Daily Market Commentary: Semiconductors Going It Alone

Image
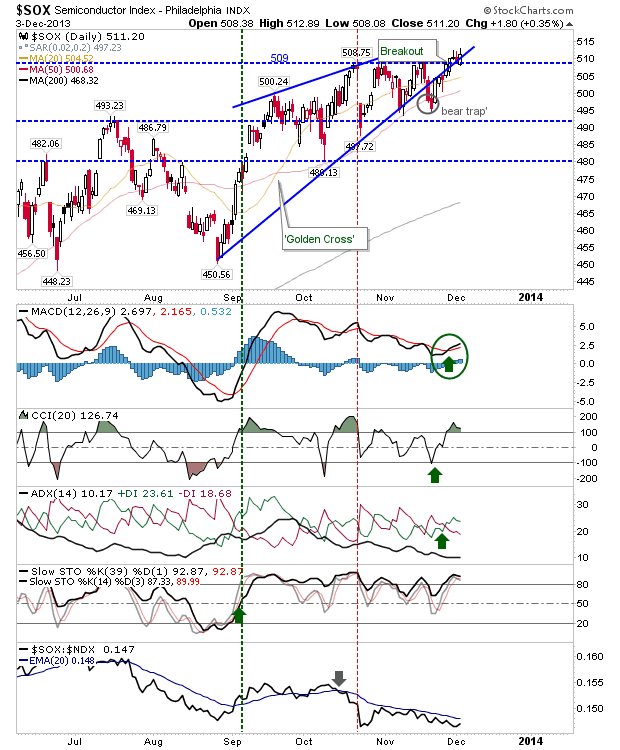
In an unusual divergence, the semiconductor index went it alone and is on the verge of a new closing high. This despite losses elsewhere, including small losses in the Nasdaq and Nasdaq 100. The uptick in the semiconductor index should offer help to the Tech indices. There was a relative shift in favour of the semiconductor index against the Nasdaq 100, but a similar move in September eventually petered out. I'm not sure there is enough momentum in the overall market to see this one through, but until proven otherwise, this bull run in semiconductors is to be respected.

Daily Market Commentary: Bulls Fight Back

Image
The easier route was for markets to move lower, undercutting support, but buyers mounted an impressive response to last week's selling, doing so on higher volume accumulation. For the S&P, it looks like the test of the 50-day MA will have to wait a little longer. Although technicals are on course for a net bearish turn, despite Monday's gain. The relative shift to Small Caps, and away from Large Caps continued.

Market Sentiment: Industrials Weakening

Image
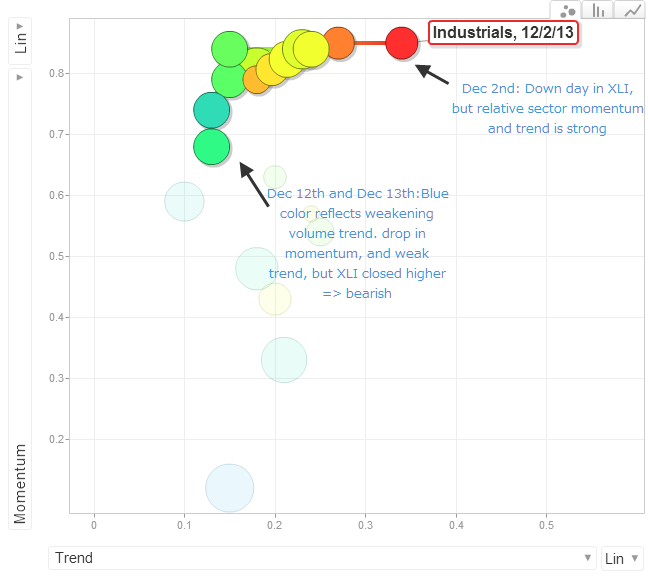
I have added a new market sentiment chart with relative momentum, trend and volume metrics in the one chart. As an example in the new chart, industrials (XLI) gained Thursday and Friday, but these gains were delivered with a drop in momentum, cooling volume and a weak bullish trend. The Relative Momentum, Trend and Volume Chart :

Daily Market Commentary: Losses Without Losing

Image
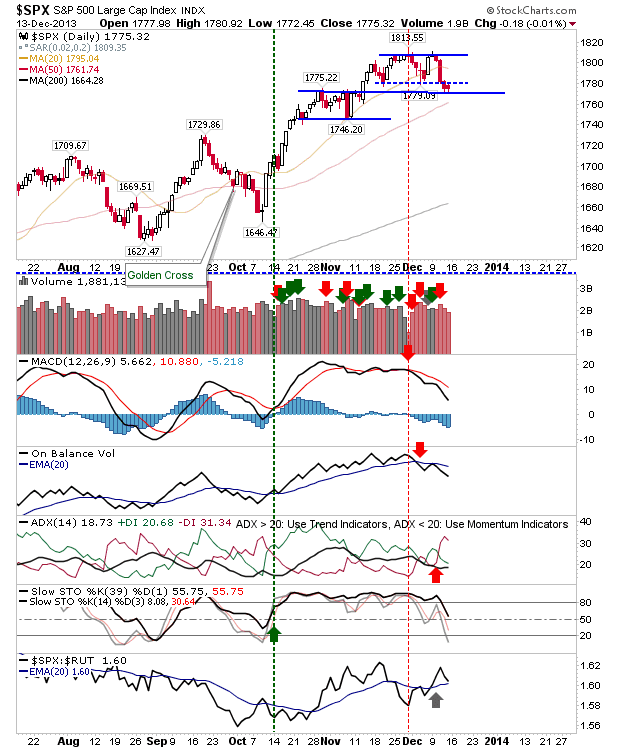
The S&P showed it best: a bright open, which failed to catch, but didn't evolve into losses. The S&P didn't break support and volume dropped. For Monday, it's still a potential bounce play, offering relatively low risk given the presence of support. Those who want to give a long play more room can use the 50-day MA as the marker for a stop - BUT - a break of this support would generate a short play with a stop above 4,018. The one thing a break of support brings is a likely one-day, rapid drop to the 50-day MA, which would leave longs fretting; hoping the 50-day MA sticks as support.

Daily Market Commentary: 'Bull Trap' in Semiconductor Index

Image
After yesterday's losses it will have been of some relief markets took a breather. However, markets did not go entirely unscathed. The semiconductor index lost nearly 1% in what amounted to an undercut of the 20-day MA, leaving a 'bull trap' in its wake. A MACD 'sell' trigger was also generated.

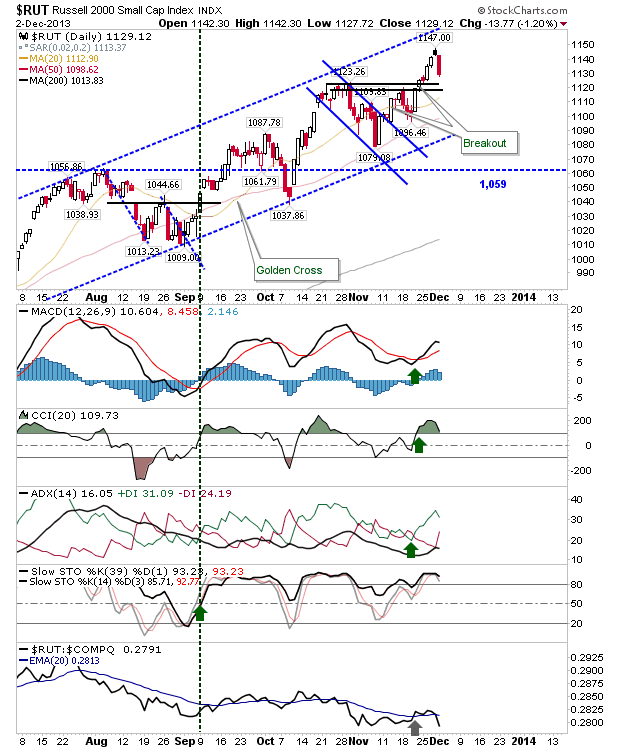
Daily Market Commentary: Russell 2000 Short Pays Off

Image
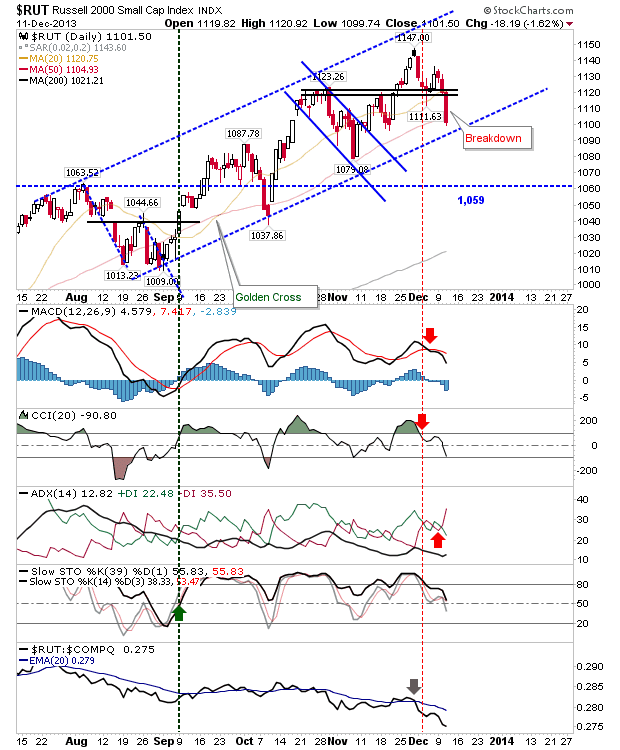
Well, those who took the plunge to short the Russell 2000 got their money's worth today. Stops could be lowered to breakeven or better, and more downside is probably on the cards. A dead-cat bounce back to the 20-day MA, much like what happened in early November, is what to watch for tomorrow.

Daily Market Commentary: Small Caps Under Pressure

Image
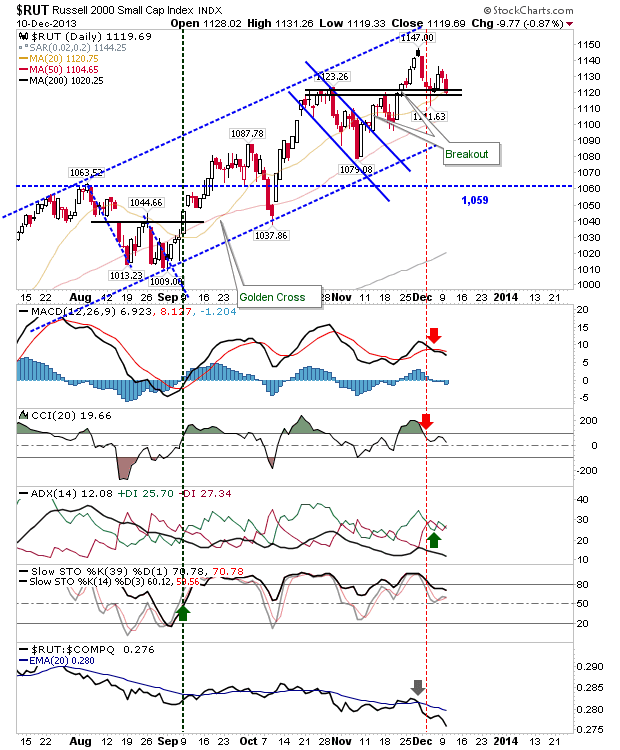
A near 1% loss for the day dropped the Russell 2000 back to support marked by the October swing high. Also here is the 20-day MA, another point to work as support. More worrying was the close near the low of the day, suggesting further losses are likely.

Market Sentiment: Inter-Sector Breadth Analysis

Image
Updated the last three days of action into the sectorbreadth chart.

Daily Market Commentary: Modest Gains

Image
The good news is that Friday's gains held up. The bad news, is little more was added to those gains. Today's highs in the S&P didn't take out the all-time high, but there was a relative swing in favour of Large Caps over Small Caps.

Daily Market Commentary: Santa is Pulling Hard

Image
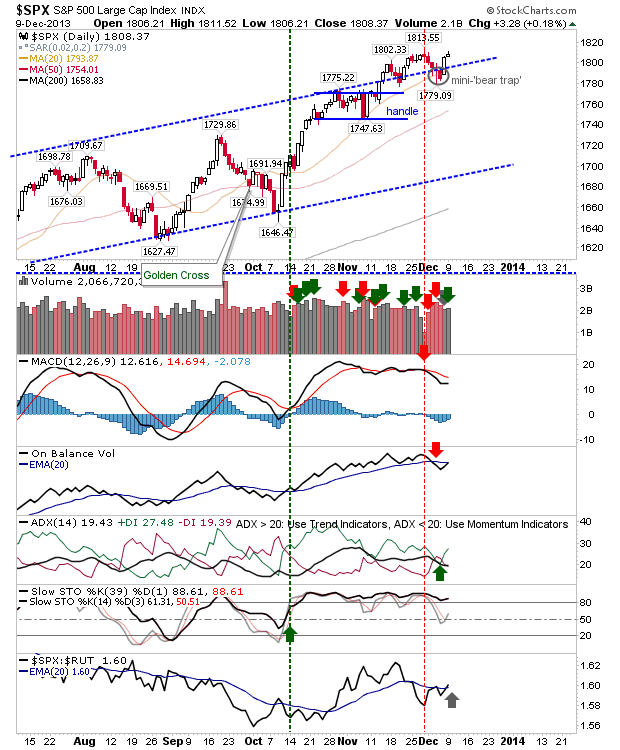
It was a valiant attempt by bulls to arrest the declines in Large Cap indices. It probably did enough to scare off shorts looking to attack Thursday's sell off, but volume wasn't exactly supporting the % gain. The S&P was able to stick its nose back above the channel line and regain its 20-day MA in the process. It's a mini-'bear trap' for those who may have shorted the cut below the 20-day MA (which pushed the index back inside its channel).  Technicals split bullish/bearish, although Friday's price action hands the ball back to the bulls.

Daily Market Commentary: Large Caps Wobble

Image
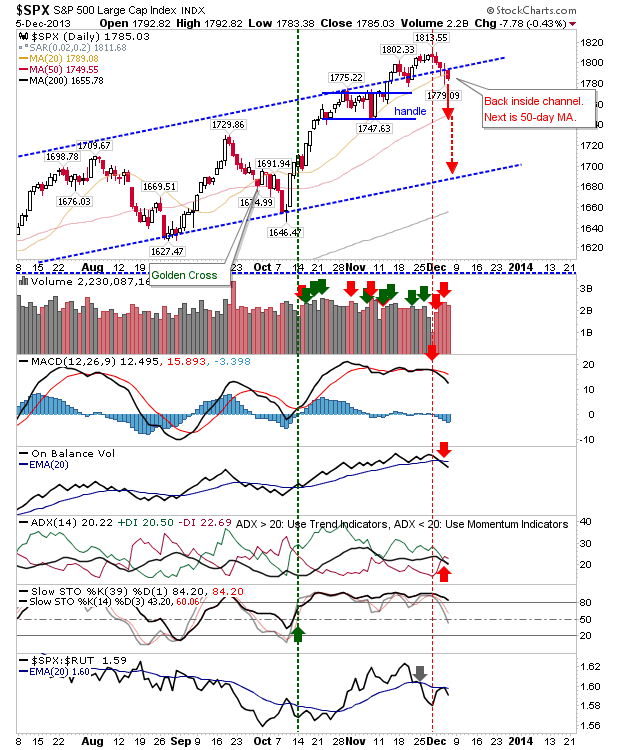
It has become a little more difficult for Large Caps following Thursday's losses. The November channel breakouts have now failed for both the Dow and the S&P, with the next move likely to be a challenge of the November swing low/50-day MA in the S&P, and 50-day MA for the Dow.  Short plays in these indices can use a close above the 20-day MA as a cover.

Daily Market Commentary: Volatility and Volume Increases

Image
It was to be expected at some point after the holidays, volatility would increase.  However, Tech averages had a relatively quiet day, although the semiconductor index had a wobble of its own. For the S&P (and Dow), the increase in volatility left the index flat by the close. The index finished on former upper channel resistance-turned-support, with the 20-day MA also seeing a positive test. However, technicals weakened further with 'sell' triggers in On-Balance-Volume and +DI/-DI, with volume picking up to register a confirmed distribution day.  Short term is set up for a bounce, but if this bounce doesn't reverse the technical 'sells', then a larger decline is likely. A close below the 20-day MA today or tomorrow would kill the short term bounce too I think, perhaps bringing in a larger test of the 50-day MA.

Market Sentiment: Inter-Sector Breadth Analysis

Image
Finally put together my sector breadth analysis to include change over time ( Looks to only work in Chrome - Timing Out in Explorer and Firefox - cross domain issue? ). Google's bubble chart working very nicely and there are lots of customisation options, including tabbed histograms.  Last 10-days with Bullishness, Sector Rank, Price Change and Price to choose from.  You can also track the trails:

Market Sentiment: Sectorbreadth

Image
Split sector performance: Defensive sectors gain, Cyclical ones lose out. Utilities ($XLU) on the rebound. 

Daily Market Commentary: Conflicting Day

Image
It was a case of selling for many of the indices, with the exception of the semiconductor index.  The semiconductor index has been a long time underperformer, but today it held on to its breakout with a modest gain. Technicals are also in good shape.  If there was a marker as to where to place your bets for a Christmas rally, Tech would look to be the place to be.

Market Sentiment: Sector Breadth.

Utilities remains on its own. Other sectors still clustered, although weakening slightly from last week. Buying opportunity exists when sector drops below 10% bullishness - Utilities at 15% currently. Minor ranking changes don't point to any potential trend shift.

Daily Market Commentary: Big Loss in Russell 2000

Image
Trading volume was not particularly excessive as traders slowly crawl back to their trading desks after the holidays. However, what action there was sided with bears. The small cap, Russell 2000, took the largest hit on the day, down over 1%. However, losses remained confined to the larger bull trend, so the real damage was relatively light.

Archive

Show more