Posts

Showing posts from April, 2015

Roller Coaster Day, But Little Change By Close

Image
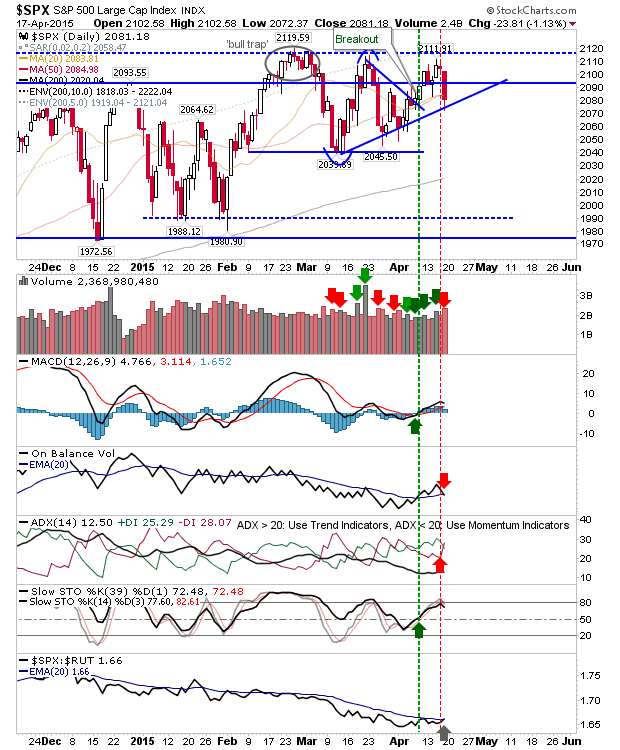
Lots of movement during the day, but by close of business there was little to say. The S&P registered higher volume distribution as it was able to defend converged 20-day and 50-day MAs.

Strong Response From Bulls

Image
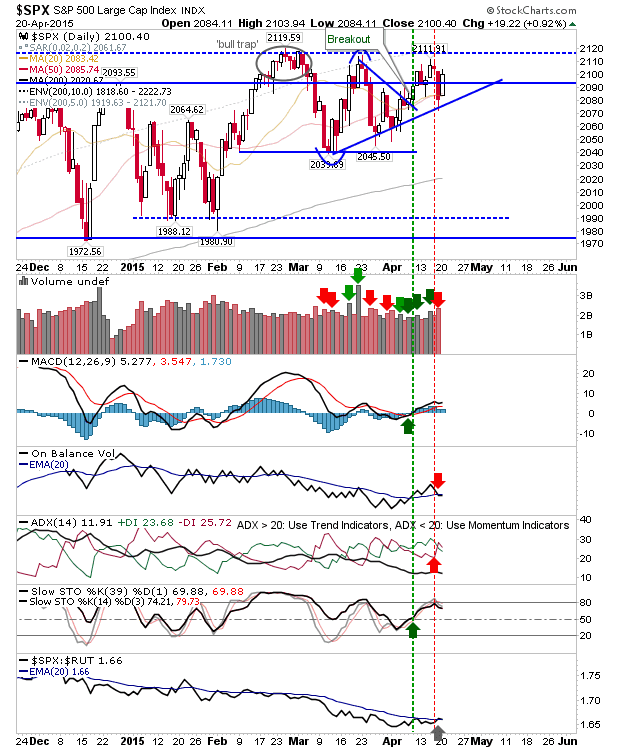
It was looking rough for bulls when cash markets opened today, but a swift recovery helped drive markets back to their daily highs, and in the case of Large Caps are close to a new breakout. The S&P finished on lighter volume buying with a 'sell' trigger between +DI and -DI. Tomorrow is set up for a breakout.

Sellers HitAppl

Image
It was day sellers had control over not long after the cash open. The Russell 2000 broke from the channel in a clean slice which left the index just above the 50-day MA. The index had already suffered a relative loss to the Nasdaq and S&P, and today's decline just accelerated this decline.

Indices Maintain Breakouts But Semiconductors Breakdown

Image
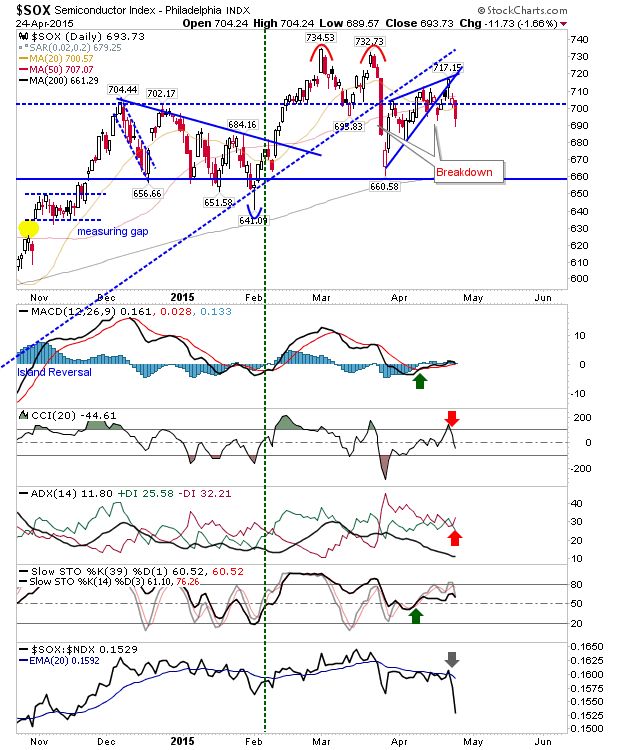
There wasn't a whole lot of action during the cash market session as indices held on to most of their premarket gains. The only index to come up short was the semiconductor index. It confirmed a wedge breakdown, and it's looking increasingly likely a double top is in play. A retest of the 200-day MA would appear to be the favored outcome going forward.

Tech Indices Add To Breakout

Image
The Nasdaq broke resistance yesterday, and today the 'bull trap' in the index was negated. Trading volume also climbed to register as accumulation, The Nasdaq is market leader against the S&P and Russell 2000; bulls will look for continued money flow into speculative issues to drive the broader rally.

Nasdaq Pushes to New Highs

Image
The Nasdaq and Nasdaq 100 gained ground, the former index is in the process of building a challenge on the 'bull trap' high, although the latter index still has converged resistance to take care of. Nasdaq gains were on lower volume, but technicals remain positive.

Sellers Return But Damage Is Minimal

Image
The spectre of Friday's selling was in the air, but when sellers did make an appearance the net result wasn't too damning. The S&P is caught in the middle between 2120 resistance and rising trendline support. There was also a relative strength shift away from Large Caps, although this is more bullish for the market as a whole.

Bulls Regain Friday's Lost Ground

Image
It was a good response from buyers to push markets higher through the day. However, the gains didn't really change the larger picture where markets remain range bound. In the case of the S&P, bulls really need a break of 2120 to bring confidence back to buyers. The S&P is also enjoying the start of a relative performance advantage against the Russell 2000.  It's early days, but today was a good start.

Bulls Lose Their Wiggle Room

Image
Sellers hit indices hard on Friday, leaving markets vulnerable to breaks of nearby support. The S&P managed to find some traction at trendline support and 50-day MA, but it won't be able to handle any further loss on Monday. To add insult to injury, volume climbed to register as distribution, and there were 'sell' triggers between +DI / -DI and On-Balance-Volume.

Breakout in Small Caps Hold Despite Small Sell Off

Image
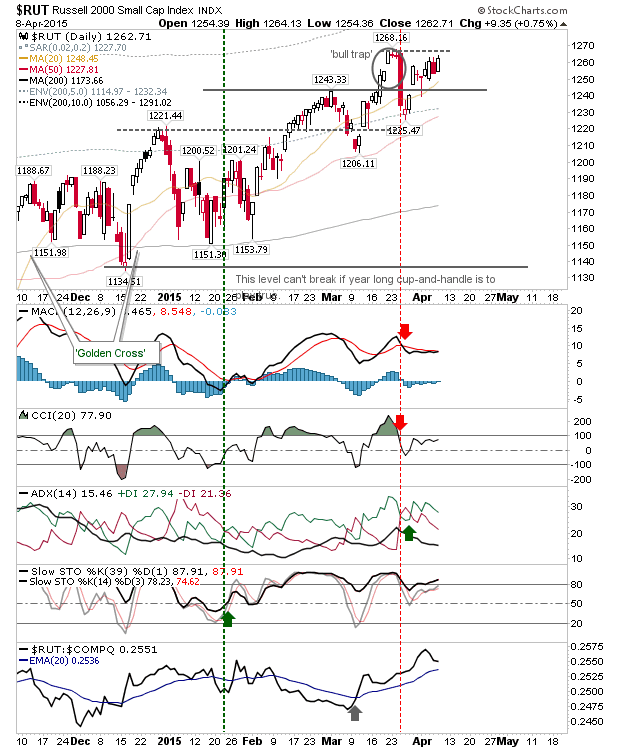
Sellers had a crack at reversing the breakout in the Russell 2000, but were unable to deliver a reversal. The index traded a very narrow range as technicals remained on the bullish side.

Russell 2000 Breakout

Image
Today there was no surprise to see a breakout in the Russell 2000 after the lead-in it enjoyed. The Russell 2000 also enjoys relative leadership against both the Nasdaq and S&P.  The current advance is bound by a rising channel, but is also at new all-time highs.

Markets Regains Early Losses

Image
Markets suffered heavy selling during early action, but were able to regain a large section of lost ground by the close. Large Caps had the best of the action, skewing buying towards more defensive issues, not surprising given the early scare. The 20-day and 50-day MAs have converged, and these played as a rally point for longs. Technicals retained their bullish picture.

Question from Reader

Image
Declan  Why is it traders like you and your ilk are uber- bullish in perpetuity? You write as if these indices have minds of there own, when in reality they are manipulated And propped up by primarily dealers trying to give the appearance of healthy indices... It never ends... The most hated bullshit market of all time.. Hi Peter, I don't think I'm uber bullish, more apathetic bullish. I would be happier to see this market take a dive so I could put my cash holdings to work instead of having them sit in the bank earning nothing!  If you look at the end of every post I show two tables which highlight levels where markets typically find historic extremes. Based on where markets lie now, there is no extreme. So one has to work with what's gone before, and that's a 6-year bull cycle which hasn't show signs of slowing.  People may think 6-years is a long time, and for many a bull rally that has gone before, it is. However, there was an 11-year gap from 1

Rejection of All-Time Highs

Image
It was not surprising to see the challenge of all-time highs rebuffed in the Nasdaq and Russell 2000. These were the indices most likely to see the benefit of buying strength, and both started off well. However, as the day wore on, bears were able to squeeze bulls out of their positions. Both of these key indices closed at lows. The Nasdaq finished with an inverse hammer as it attempted to challenge the 'bull trap'. Volume climbed from Friday to register distribution, although it wasn't particularly high volume overall. Tomorrow may see some follow through down, but there is plenty of support to work with, starting with 20-day and 50-day MAs.

Buying Strength Builds Pressure on All-TIme Highs

Image
A solid Friday to close the week helped push indices towards a challenge of 2015 highs. Volume climbed to register strong accumulation for the Dow and S&P, although things were quieter for the Nasdaq and Nasdaq 100. The Russell 2000 sits just 4 points shy of a new all-time high. Last week's action offered step-by-step advance towards breaking the 'bull trap' at 1268. There is a good chance this high will be posted by Monday's close.

S&P Confirms Consolidation Breakout

Image
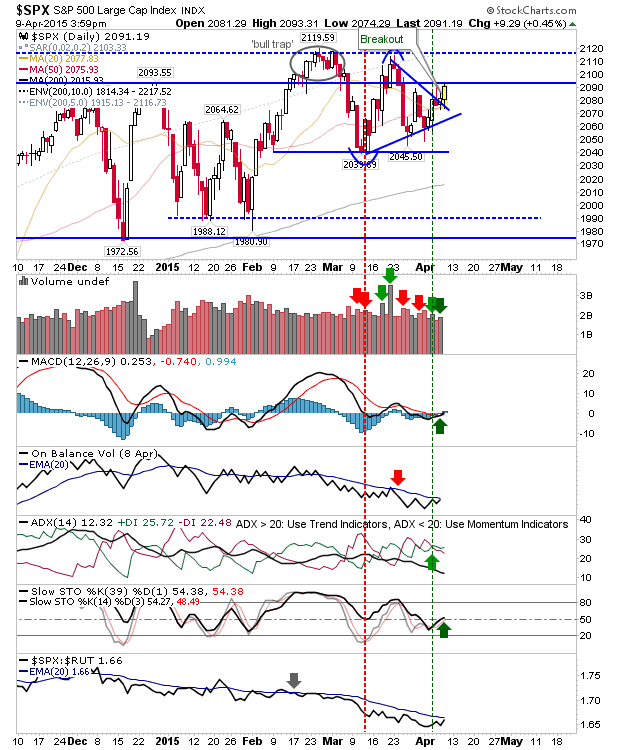
Markets are still bound by the larger range from March, but there was a consolidation breakout on offer from the S&P. It still has overhead supply to work with, but today's buying registered as accumulation. The S&P enjoyed a MACD and Stochastic 'buy' along with today's action. However, On-Balance-Volume still has to trigger a 'buy' signal to turn all technicals net bullish.

Tech and Small Caps had best of action

Image
I started the day with a short in the Nasdaq 100, and ended the day stopped out. Large Caps didn't quite reach the same highs, but will likely follow the leadership of the Nasdaq and Small Caps. The Russell 2000 will likely lead the indices out. It's very close to negating the 'bull trap'. Tomorrow could be the day.

Late Selling Helps Build Market Consolidation

Image
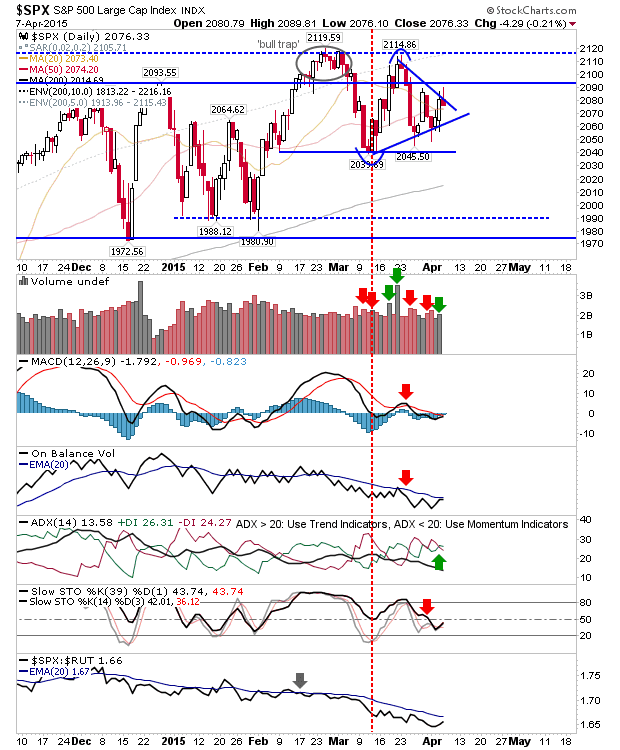
Markets are coiling towards a decision point (within a larger range defined by March high/lows), although markets sold off in late trading to give bears an opportunity to squeeze bulls tomorrow.  If bears win, then a retest of March swing lows is favored, and failing that, a move to December lows. The S&P is oscillating around the 50-day MA. Today's high at 2,089 marks a short risk level for a push to the March low of 2,039.

Range Bound Noise

Image
Friday's gains came off the back of weak technicals, and didn't really change the larger picture. The S&P is bound by the March swing high/low (the high also marking a double top around 2,115). Until either of these levels break there is little more to add. Even the 20-day/50-day MA isn't offering much help.

Bulls Continue To Defend Recent Swing Lows

Image
Today's losses took indices to test March lows before buyers stepped in to bring things back by the close. For the Nasdaq, bulls came in at the 50-day MA, although today's action registered as higher volume distribution.

Archive

Show more