Posts

Showing posts from October, 2023

Weekly trend break for S&P
Image
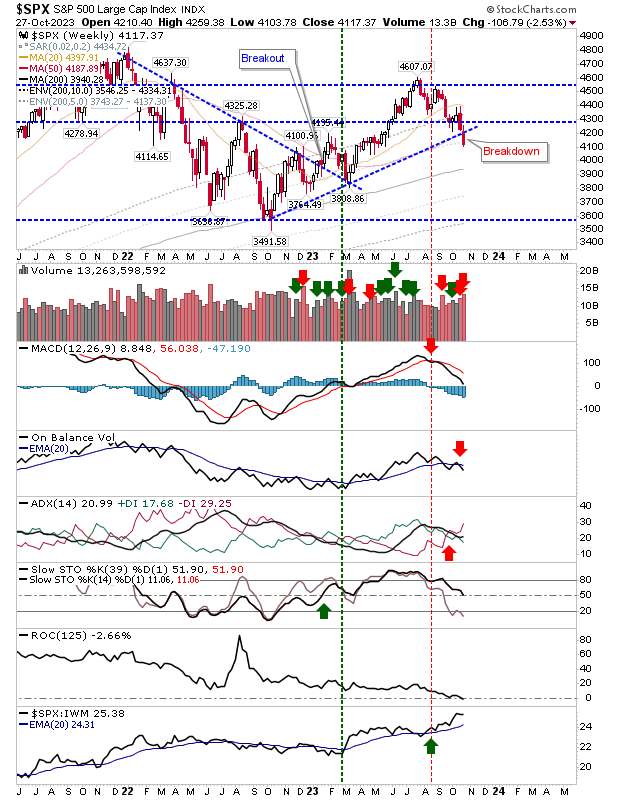
Daily charts show indices in a bit of a freefall, so focus shifts to weekly timeframes. The S&P was the last of the lead indices to break weekly-trend support, lining up the 200-day MA for the next support test. Volume climbed to register as distribution, rubbing salt into the wound of bulls. The only positive for bulls is that intermediate stochasics [39,1] are above the bullish mid-line, but with other technicals turning negative it's unlikely to stop the rot.

S&P and Nasdaq play catchup with Russell 2000 weakness

Image
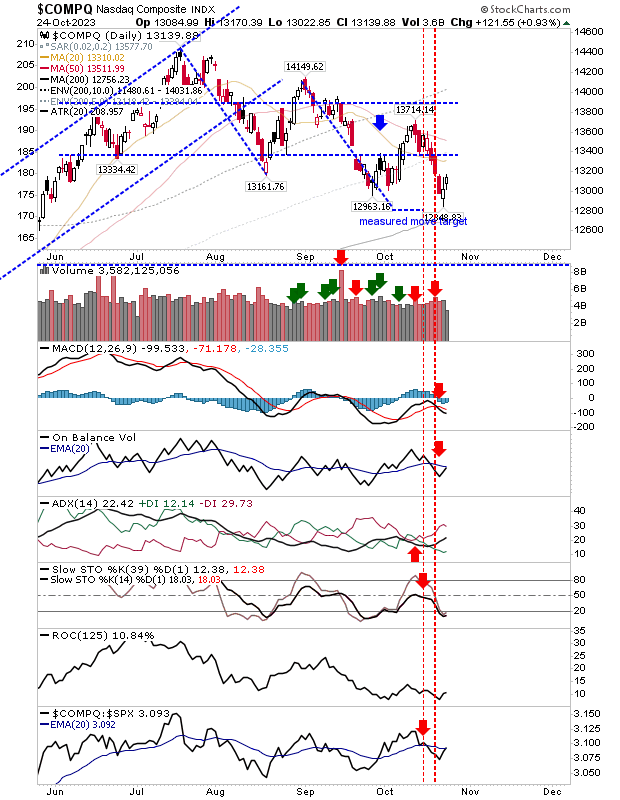
For a change it wasn't the Russell 2000 taking the bear market highlight report, but the S&P and Nasdaq instead. It was always going to be hard for indices trading near prior swing lows to hang on to those lows with the peer Russell 2000 ($IWM) was in freefall. Today saw a decisive break of the 20-day MA for the Nasdaq, with only the (generally) light volume acting as some succor, while the S&P registered a firm distribution day. Starting with the Nasdaq, the measured move target that had offered some support alongside the 200-day MA is no more. We can now start tracking the percentage loss relative to this moving average before we get to a major swing low, although a loss greater than 10% against its 200-day MA is needed before we get to a period of historic weakness greater than 90% of past price action dating back to 1971.

Indecisive bounce for indices

Image
At this stage, only weekly time frames are important as we track "Crash Watch". It's a tricky situation as the S&P and Nasdaq don't look vulnerable, but the Russell 2000 ($IWM) is really struggling. Starting with the Nasdaq, we have a technical negative picture but it that remains above 200-day MA support. This looks like an index in the process of forming a (multi-year) trading range, but even if this is the case, it's still early days as no trading range boundaries have been set. The S&P tagged its 200-day MA, returning above this moving average after today's close. Buying volume was less than previous days selling distribution, but there are grounds for buyers to step in at a logical support level. The Russell 2000 ($IWM) did manage to post a gain today, but the candlestick was a neutral doji, not one to inspire confidence. Technicals are bearish and oversold and show little sign of a recovery. It's still early in the wee

Friday's finish leaves markets struggling on weekly time frames

Image
I'll leave the chat on the daily time frames for later this week, but Friday's damage has left markets struggling on a weekly time frame. It's not all doom and gloom, but come this Friday, there will need to be some buying flourish if we are not to start looking for support dating back to the end of 2022 (or worse for the Russell 2000). The S&P is in the process of testing rising support connecting swing lows of October 2022 and May 2023. Last week's volume ranked as distribution with a new 'sell' trigger in On-Balance-Volume to go with earlier 'sell' triggers in ADX and MACD. Stocahastics are still well above the mid-line, which is perhaps the best sign that the bullish shift triggered in January of this year can continue.

S&P and Nasdaq gives up daily breakout support, opening weekly support for a test

Image
A triple whammy for indices and one where bears took all the plaudits. The Russell 2000 ($IWM) experienced an ugly distribution day that drove through the prior spike low. We now have a crash opportunity that could spill into the weekly time frame. I should add, we are only 7% below the 200-day MA and Russell 2000 losses generated by crashes typically touch into a 15% loss or more against the 200-day MA. However, we are in accumulate mode, so if you are an investor, then buying Small Cap stocks should see reward in the coming years; if we get down to 20% loss against the 200-day MA, then back-up-the-truck.

S&P and Nasdaq hold breakout support

Image
It hasn't been pretty, but it has been effective as both the Nasdaq and S&P have so far managed to defend the breakouts from their September lows. Although, price has done the business, intermediate stochastics [39,1] have remained on the bearish side of their respective midlines.

Russell 2000 on the verge on new low in July - October decline

Image
It was a tricky Friday for the Russell 2000 ($IWM) as the index experienced additiional losses to take it on the verge of a new low for the decline initiated in July. The MACD is still holding to its 'buy' trigger (a weak 'buy' as it occurred below the bullish zero line), and at least volume didn't register as distribution, although that's about all you could be positive about.

The Russell 2000 sells off hard on volume distribution

Image
The Russell 2000 ($IWM) is the canary in the coal mine for markets and today's action is not great news for the S&P and Nasdaq, despite the latter indices doing 'okay' today. Selling volume rose to rank as distribution with a 'sell' trigger for On-Balance-Volume. Relative performance accelerated in its decline against the S&P (and Nasdaq), but this has been the case since August. The only positive is the residual MACD 'buy', but this signal occurred well below the MACD zero line, not a good trade signal and one liable to fake out.

Swing lows taking shape across indices

Image
It's early days, but indices are working towards swing lows to help start rallies off last week's lows. The Nasdaq took out the swing high from last week and its 20-day MA, but was repelled from its 50-day MA with today's spike high. The buying came with MACD trigger, ADX and On-Balance-Volume 'buy' triggers. If the buying continues, then a stochastic 'buy' will complete the net bullish technical picture over the coming days.

Nasdaq and S&P hold weekly support

Image
Friday's surge on daily time frames set up solid finishes on weekly time frames for the Nasdaq and S&P, although the Russell 2000 ($IWM) remains in trouble. The S&P has posted a 'bullish' hammer on 4,275 support, although the reversal potential of this candlestick is reduced by intermediate-term momentum caught in a bit of a no-mans land, but short term momentum is oversold and volume registered as accumulation. What the strong finish has also done is set up a new relative performance high against Small Caps via the Russell 2000 ETF ($IWM).

Russell 2000 ($IWM) experiences two heavy days of selling

Image
It has been a tough start to the week for the Russell 2000 ($IWM). A bearish end to the week last has been followed by a disappointing Monday. The measured move target marked on my chart offered a launch point for a rally, but this rally quickly got overwhelmed by a former support level, turned resistance, around $178. To add to the misery, volume climbed in confirmed distribution for both Friday and Monday, and relative performance against peer indices (Nasdaq and S&P) took a sharp turn lower. There is no love for market leading Small Caps, and now have to look at 2022 lows around $160 as a possible support test.

Archive

Show more