Posts

Showing posts from February, 2013

Stock Picks: $LLY, $BEAM, $CVS, $ORLY
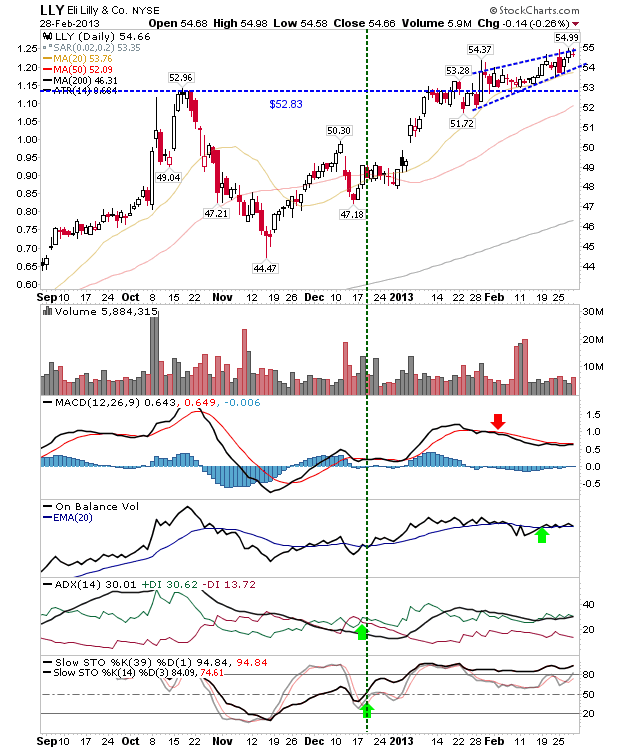
Image
Four stocks featured in my latest Fool post here . The technical picture is provided below: Eli Lilly is held in my investment portfolio. The stock cleared $52.83 on modest volume and saw a pick up in volume as the stock made a confirmation test of $52.83. There is a narrowing rising wedge which - if fulfilled - will break downwards. A breakdown could evolve into a false breakout, but should this happen, look for a defense of the 50-day MA.

Daily Market Commentary: Another Day of Distribution

Image
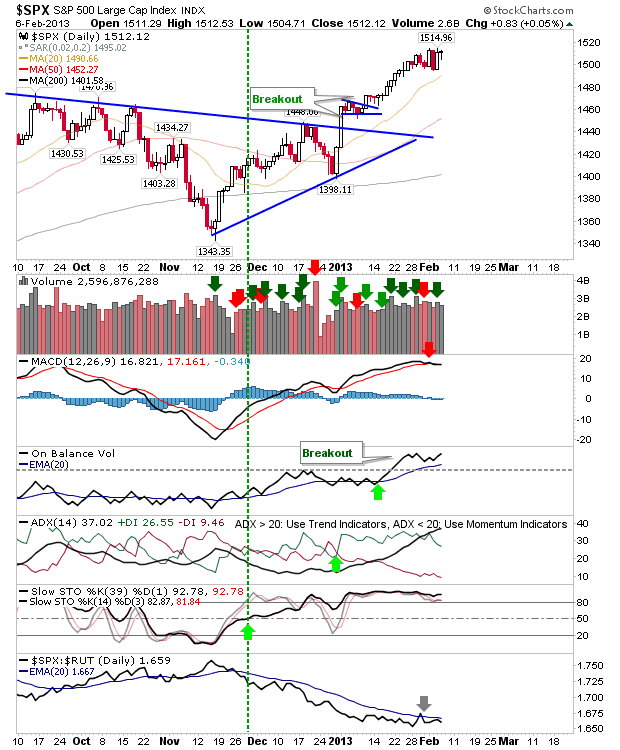
While the rally flattens out, there is one side of the market which has sided with the bears, and that's the number of distribution days. The S&P has experienced five consecutive distribution days since the last accumulation day. However, On-Balance-Volume has maintained its accumulation trend, although it's under pressure from bears. Relative strength has shifted in favour of the S&P, which is bearish for the broader rally - although better news for the S&P.

Daily Market Commentary: Low Volume Recovery

Image
Big gains, but modest volume. The battle is on to decide whether yesterday's action marked a swing low, or if markets are in the process of shaping a top. Technicals and breadth indices suggest this is a top and the current bounce is nothing more than a relief move. But, a new all-time high will have to be respected, despite what technicals may otherwise suggest. But we are not there yet. The S&P didn't make it as far as its 50-day MA before bouncing.  The 'sell' in the ADX was reversed.

Daily Market Commentary: Well - That Didn't Last

Image
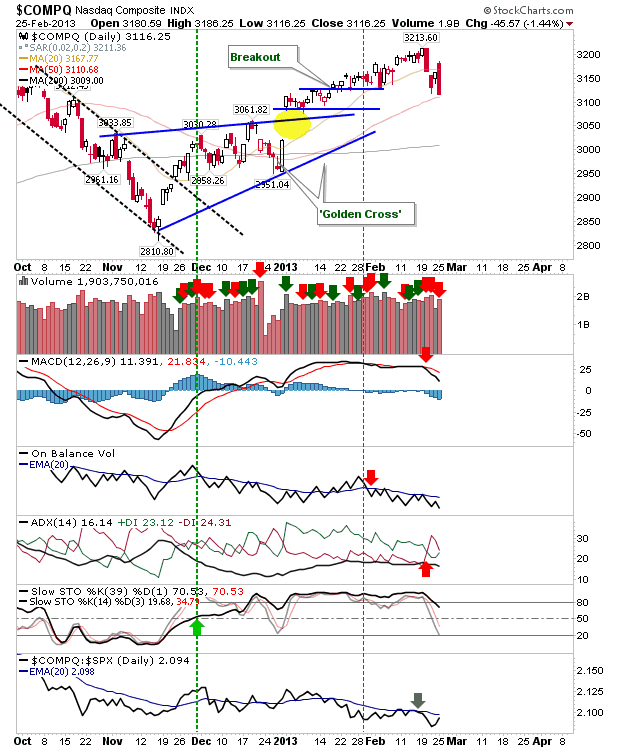
I was expecting a little more from bulls than a single days recovery, but it wasn't to be. Volume climbed to register a distribution day as shorts jumped on the push back towards 20-day MAs. After today's selling, 50-day MAs are now the next downward targets. The Nasdaq gapped over its 20-day MA, but finished just a few points above its 50-day MA. Tomorrow is a key day for the average; a loss of the 50-day MA means the 200-day MA at 3,009 is in play.

Stock Picks: $FN, $QIHU, $SHFL

Image
Fabrinet featured February 19th .  The stock enjoyed three days of strong buying in early February before consolidating at $16. It made a break of $16 in what should have been a continuation of the move, but the rally failed to materialize. A MACD trigger 'sell' has to be noted, but other techincals are firmly in the bullish camp. Remains a long play until there is a break of the 20-day MA and/or $15.51 - whichever is the lowest.

Weekly Market Commentary: Breadth Sell

Image
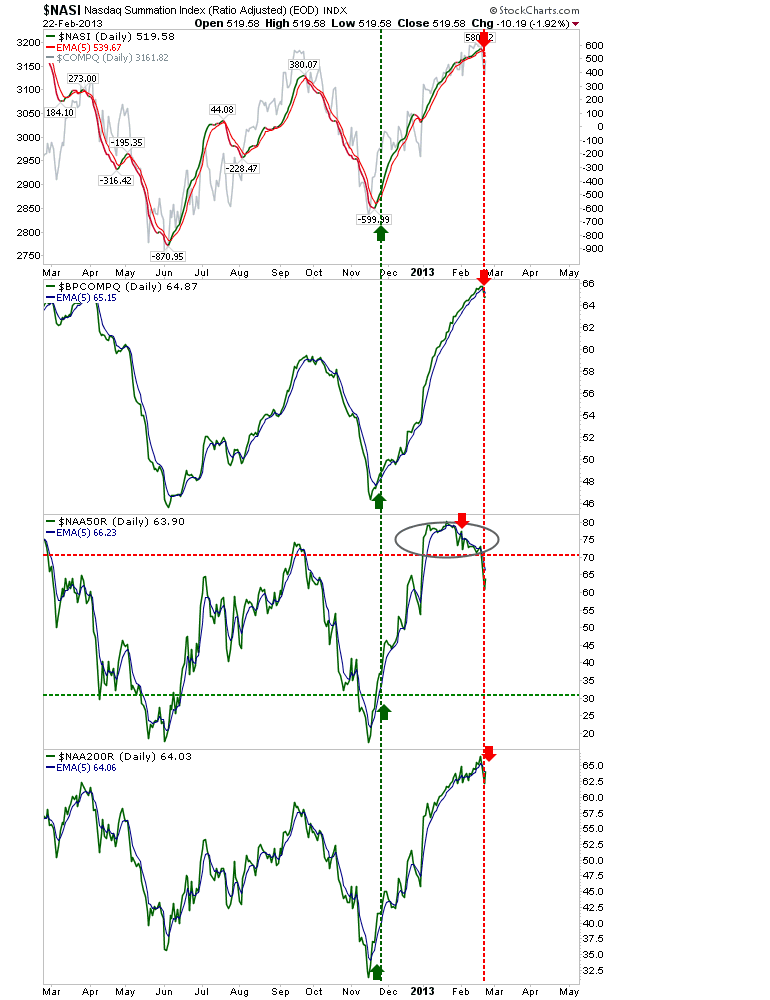
While Friday saw a low relief recovery which allowed some indices finish above their 20-day MAs, there was no such bounce in market breadth.  Indeed, Nasdaq Breadth Indices have confirmed a 'Sell' - led by the Percentage of Nasdaq Stocks Above the 50-day MA.

Daily Market Commentary: Selling Day 2

Image
In the end, 20-day MAs didn't prove to offer too much of a defense from sellers. Volume climbed in confirmed distribution as profit taking ruled the day's action. Next in line are 50-day MAs.  These should offer a more substantial defense. The move to selling has coincided with a relative shift away from speculative Small Caps to defensive Large Caps.

Daily Market Commentary: Higher Volume Selling

Image
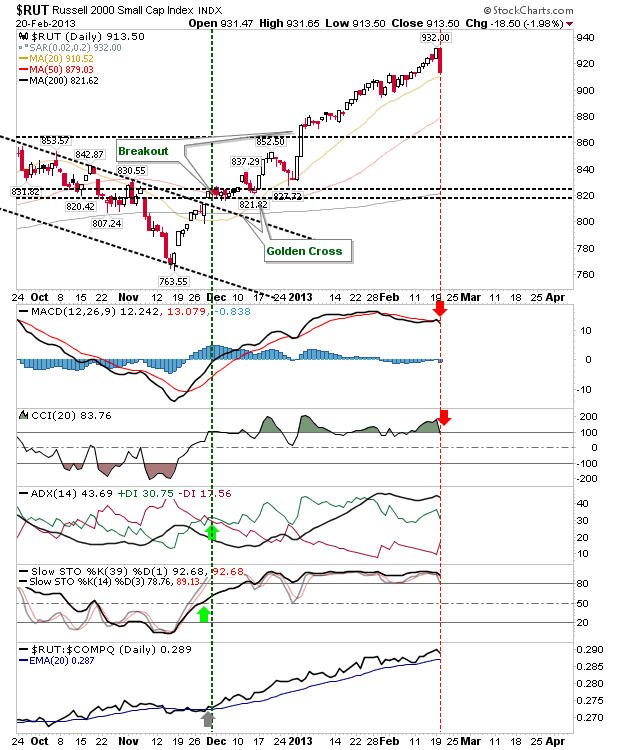
It had to happen sooner, rather than later. Sellers made their presence felt as they pushed markets towards 20-day MAs. A similar sell off occurred in early February and the market made an immediate recovery.  I would expect 20-day MAs to be a point of entry for buyers. The question is: will buyers outnumber sellers? The Russell 2000 finished a few points above its 20-day MA. The selling was enough to reverse the whipsaw 'buy' signal in the MACD. The likelihood is for buyers to stall things for a little at the 20-day MA, but the 50-day MA seems a more appropriate place to trade a meaningful bounce.

Daily Market Commentary: Continues Last Week's Action

Image
In honor of last week, markets continued their inch-by-inch gains higher. The Russell 2000 took home of the best of the days action, gaining almost 1%. The Russell 2000 also enjoyed a MACD trigger 'buy' as it built on its relative advance against the Nasdaq and S&P.

Weekly Market Commentary: Breadth Running Hot

Image
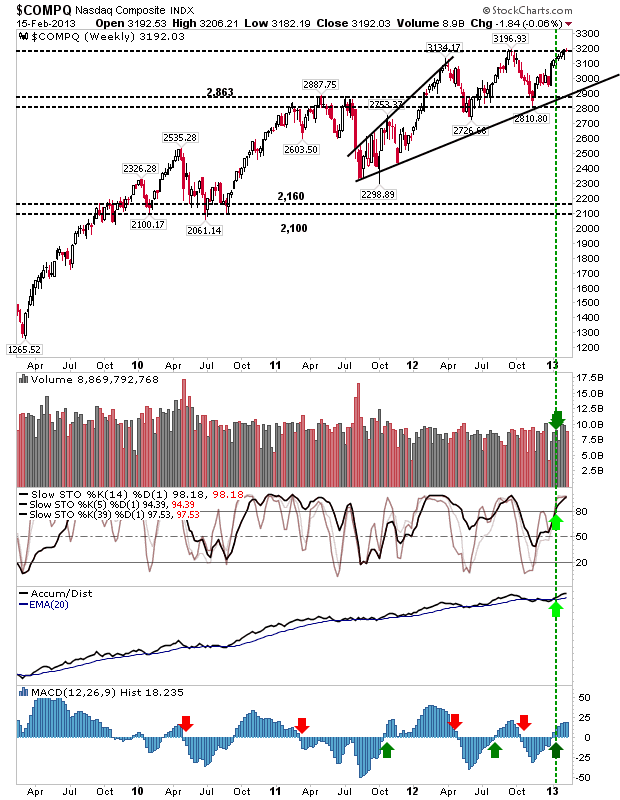
The Nasdaq spent yet another week at, but unable to hold a break of, 3,200. It remains the one index unable to close at multi-year highs. It's somewhat worrying the breakout hasn't come, as some breadth climbed, but the Percentage of Nasdaq Stocks above their 50-day MA has clearly topped.  With fewer stocks to support the advance, it will be hard for the Nasdaq to follow the action of the S&P and Russell 2000.

Daily Market Commentary: For Today, See Yesterday (and The Day Before)

Image
Nothing has cracked yet, but eventually it will. Because of the tight action, any regular move up or down will be seen to be greater than it might otherwise look. The most likely reaction is an exhaustion run higher, which quickly turns lower, resulting in a more substantial decline. However, there are no guarantees!   The S&P expressed another doji on higher volume accumulation.  Can the MACD swing higher? It would offer a handy boost for bulls.

Daily Market Commentary: Small Caps Have Best of Action

Image
The handful of buyers who haven't bought this rally are keeping thing ticking along.  Small Caps had the best of the quiet action, edging a little higher. The Russell 2000 is on the verge of a MACD trigger 'buy'. Other technicals are positive.

Daily Market Commentary: Sliver of Gain

Image
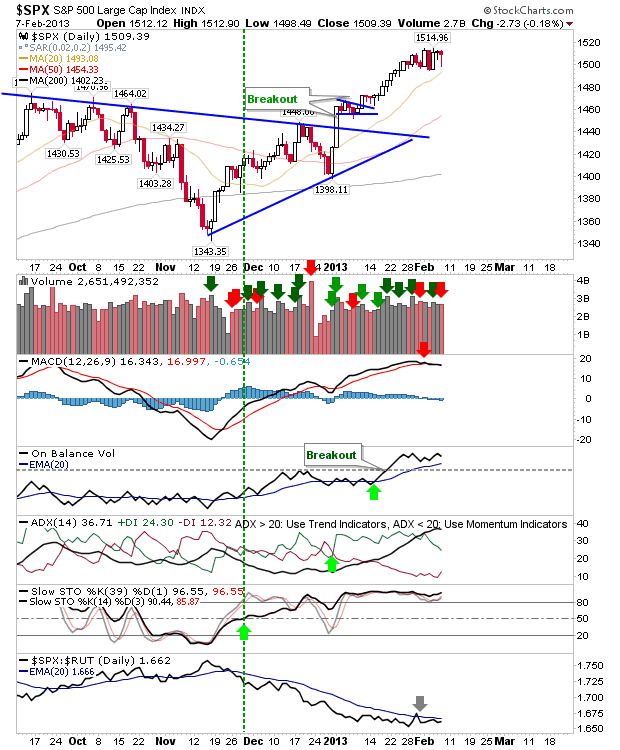
Again, there wasn't much on show, but what little there was ended up with small gains. The market has maintained an overbought state since the start of the year, and other than a brief attempt at a test of 20-day MAs, it has did little else but climb. The S&P added a couple of points, with the MACD flatlining, but doing so well above the bullish zero line.

Stock Pick: Fairchild Semiconductor International ($FCS)

Image
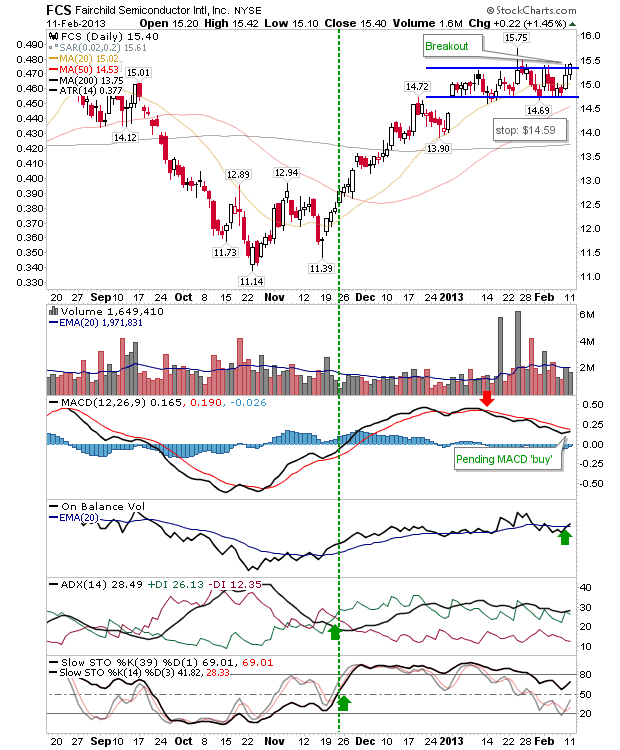
My latest Motley Foll post is available here  and covers Fairchild Semiconductor Index. The stock is in the process of breaking out of its trading range, with a pending MACD trigger 'buy'.  Stops can go on a break of the trading range low (supported by the December breakout gap).

Daily Market Commentary: Very Quiet

Image
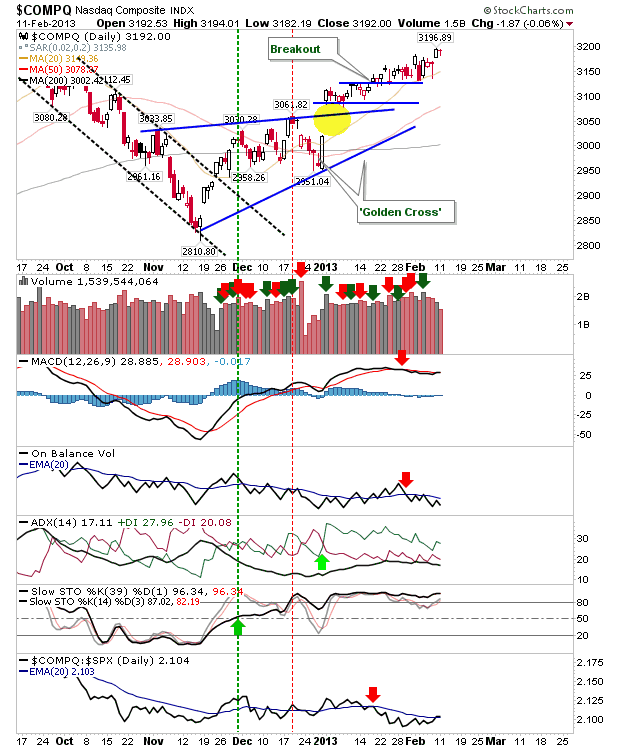
Last week closed with a bit of flurry, particularly for Tech indices.  But today the market traded well within itself.  Volume also dropped significantly. In effect, a day passed, but nothing more need be said. The Nasdaq had cleared its consolidation on Friday, but has yet to negate the MACD trigger 'sell'.

Weekly Market Commentary: Another Week - Another High

Image
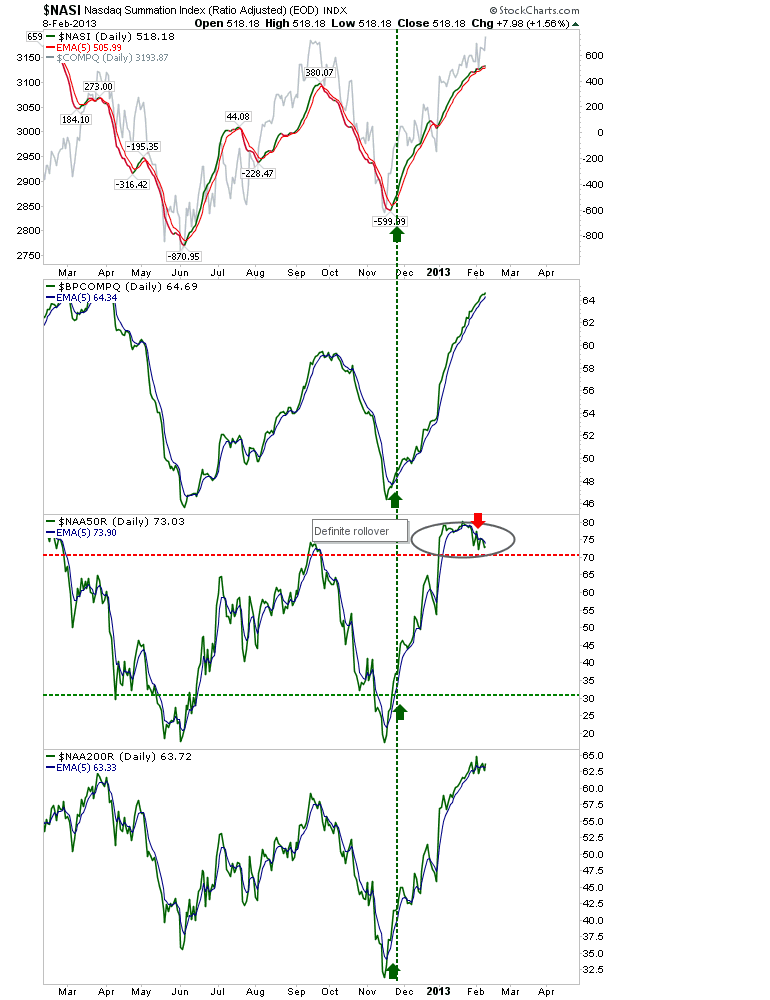
The market keeps on rolling, but there is a confirmed top in the Percentage of Stocks above the 50-day MA. The pullback is coming, but it could be another week or two before it gets there. Profit taking is a solid strategy here, with the next drop below 30 in the Percentage of Stocks above the 50-day MA the opportunity to shop for stocks once again.

Daily Market Commentary: Bulls Resist Bears

Image
It was another day where early bearish selling was unable to sustain itself into the close. The S&P came close to a test of its 20-day MA at the intraday low. The MACD trigger 'sell' remains in play, but other technicals are firmly in the bullish camp.

Daily Market Commentary: Bears Rebuffed

Image
Today's action was narrow, but an early attempt by bears to push a sell off was quickly reversed.  Indices finished near their highs, and are well placed to push higher. The S&P has had an up-down past few days, but today's action suggests bulls hold the best cards.  The MACD will likely reverse its 'sell' signal soon, returning Technicals to their net bullish state.

Daily Market Commentary: Schizophrenic

Image
It has been a confusing past few days for the market, up - down - up, with very little net change. If there is an edge, it favors bulls as buying volume increased to register as a confirmed accumulation day. However, this consolidation could play out for longer as overbought conditions work there way out. The S&P still holds to a MACD trigger 'sell' as it looks to regain relative leadership against Small Caps (which isn't good for the health of the broader rally, but will protect the S&P from the worst of any upcoming losses).

Weekly Market Commentary: Sharp Reversals

Image
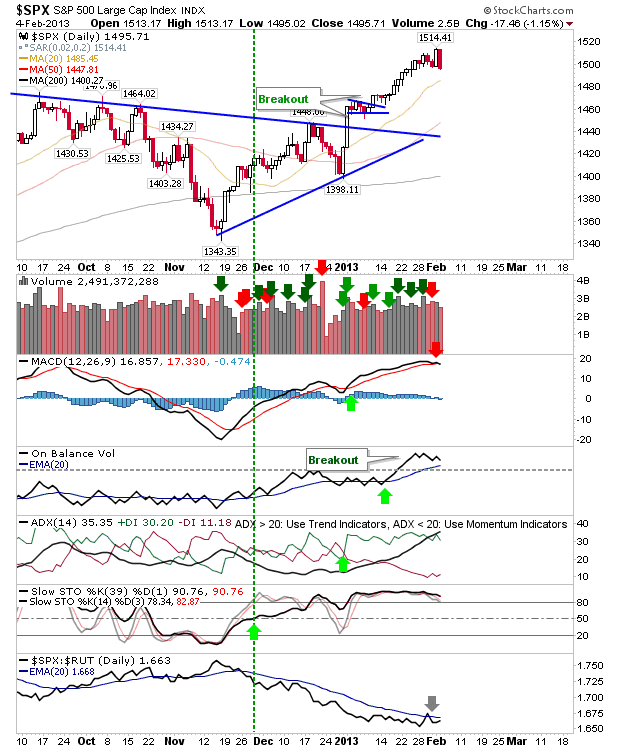
Monday delivered a substantial reversal to Friday's gains, but trading volume fell - offsetting much of the pain of today's losses. There were other shifts too. In the S&P there was a MACD trigger 'sell' to come with the drop. The 20-day MA is looking a plausible test tomorrow.

Stock Pick: $IMAX

Image
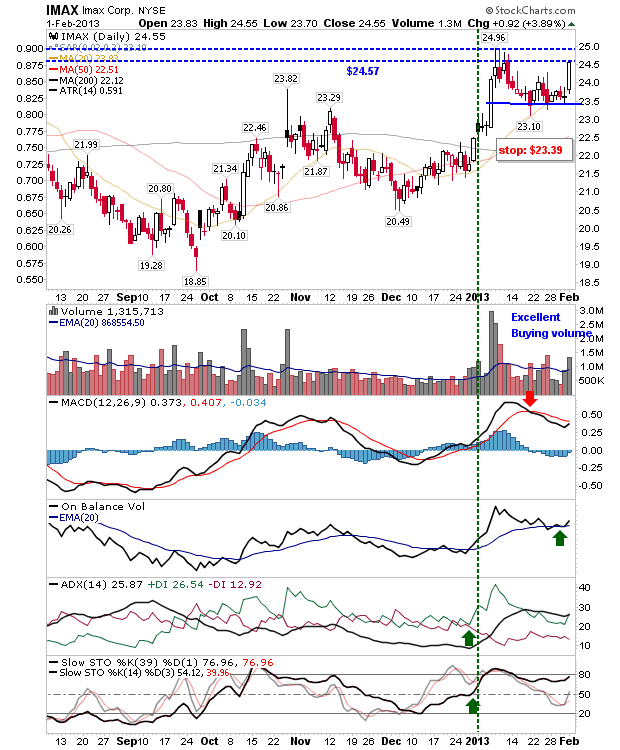
A stock to watch for next week is IMAX. The stock got a solid boost on Friday as it rallied off its 20-day MA on increasing volume.  There is still the challenge of clearing $25 after the initial push on 5.0 million shares.  My fundamental opinion is here .

Luxury Investing? $COH, $KORS, $MOV, $TIF

Image
Movado ($MOV) sits on the verge of a breakout and is showing good form.  You can read my 2 cents on the fundamentals.

Weekly Market Commentary: Rally Keeps on Rolling

Image
I thought at some point last week we would see a top in the market, but Friday put paid to that.  Across the board gains (on lighter volume) meant new highs for Large and Small Cap indices. Tech indices even gave some indication of breaking from a month long consolidation.  The real star on Friday was the semiconductor index.  It neatly took out the Bearish Evening Star, but is coming up against channel resistance.

Motley Fool: Covered Call Opportunities $KKD, $THC, $TSO

Image
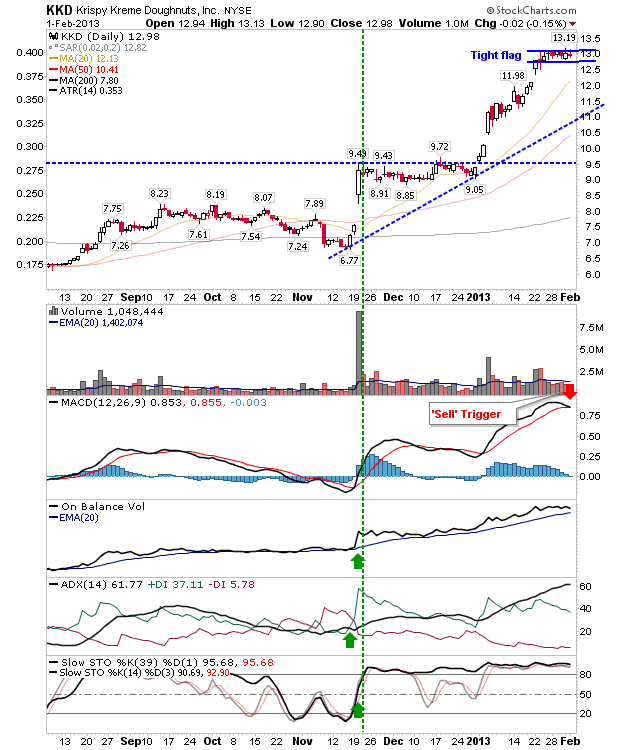
My latest post looks at the covered call potential of three strong performing stocks: Krispy Kreme Doughnuts, Tenet Healthcare and Tesoro Corporation.

Archive

Show more