Posts

Showing posts from February, 2015

Second Day of Quiet Action

Image
The S&P lost a little, the Nasdaq gained a little, but there was no change in the larger picture.  The S&P registered a distribution day, of sorts: volume climbed, but as the index finished with a doji it doesn't really qualify as a heavy sell off day. The selling volume was enough to generate a 'sell' trigger in On-Balance-Volume too, but the whipsaw risk is high.

Stall in Action

Image
Not a day to get excited with. It would be pointless to say too much, so here are the charts:

I'm on eToro

I'm looking to give eToro a spin for fun. I emphasis the 'fun' because I will only be working with an account of a couple $100 and my positions will be small (about $20 a pop). If you wish to join me, follow this link . Financial sites regulated by small islands are not my idea of financial well being (although we won't mention FXCM), so I will be keeping my account small and I recommend others to do likewise.  The aim is to use eToro as a call tracker with real money, even if the gross amount is tiny. I'll be using it to trade FX, Indices and Commodities, with some stocks (of the limited number they cover). If you already have an eToro account, feel free to follow me .

Dow and Semiconductor Index Add to Gains

Image
It was another relatively quiet day for the indices, except for two. The Dow pulled away from breakout support, although volume was lighter. Technicals are all net positive.

Holding Friday's Gain

Image
In what amounted to a really dull Monday, indices were able to hold Friday's gains. Anything else to say is really just noise. As part of the noise is a relative shift in the semiconductor index away from Semiconductor Index, to the Nasdaq 100. However, the price breakout held.

Dow Breakout Continues Market Strength

Image
A fresh breakout for the Dow continued the strong run of form for the indices. The Dow closed above 18084, as early morning weakness was unable to crack bulls resolve. Volume climbed to register accumulation.

A Repeat of Yesterday's Action

Image
For today, see yesterday. There is really very little to add on that. I'm surprised the S&P is holding on to its breakout given how tight it is to 2093 support.

Small Caps Take Best of Action

Image
There wasn't a whole lot of action on the day, but the Russell 2000 was able to add nearly a quarter a percentage point and hold on to its breakout. Technicals have stayed net bullish since the break from the original channel (which ultimately led to the current trading range).

Little to Add...

Image
Despite the long weekend there was very little change in the markets. Markets are holding near highs, which is good news for bulls looking for breakouts to hold. The index to watch out for is the Russell 2000. As the speculative index it leads out on major market reversals, and at the moment its clinging on to a breakout.

Breakouts Hold

Image
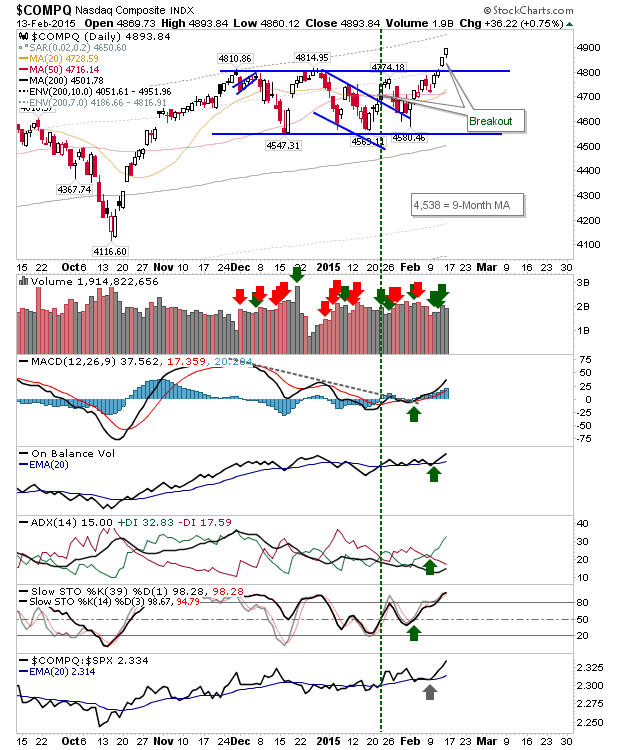
The Nasdaq put further distance on its breakout as technical strength improved. Volume fell, perhaps the only sour note on Friday. However, continued strength in Tech indices will help maintain breakouts in other indices .

Tech Indices Breakout

Image
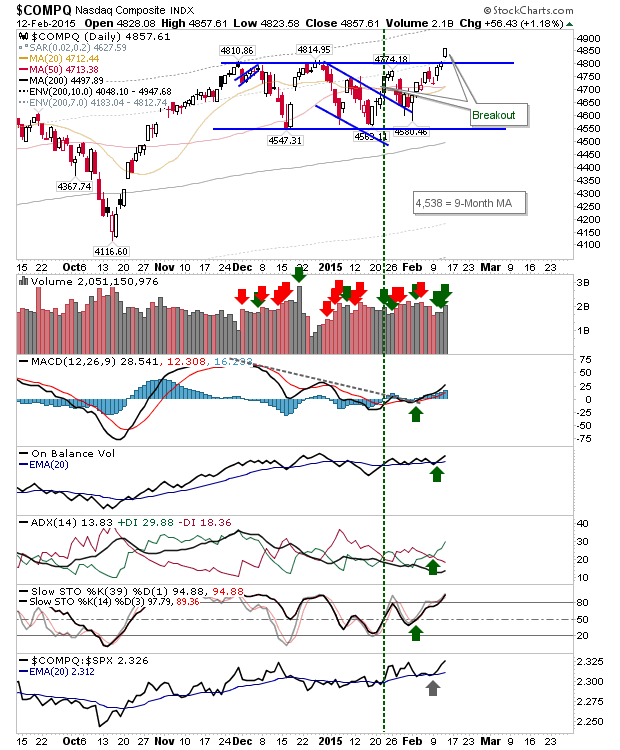
After a solid setup yesterday, the Nasdaq and Nasdaq 100 broke higher today. Supporting the breakout was an increase in volume, marking confirmed accumulation. Technicals also remained aligned with bulls, staying net bullish.

Nasdaq Primed to Breakout

Image
Yesterday it was the S&P and Semiconductor Index which broke higher.  Today that honor almost went to the Nasdaq, but it couldn't quite do it. However, the Nasdaq is well placed to do so tomorrow. The Nasdaq finished with an accumulation day, and the consolidating breakout in the Semiconductor Index should help deliver the break. Technicals are nicely positioned as net positive too.

Breakouts for S&P and Semiconductor Index

Image
It took a couple of days, but the S&P finally edged above the consolidation in place since the start of 2015. The challenge of the 2,093 high might not be so difficult to break. Volume climbed to register accumulation, although overall buying volume was not particularly high.  Technicals are (slightly) bullish.

Still No S&P Breakout

Image
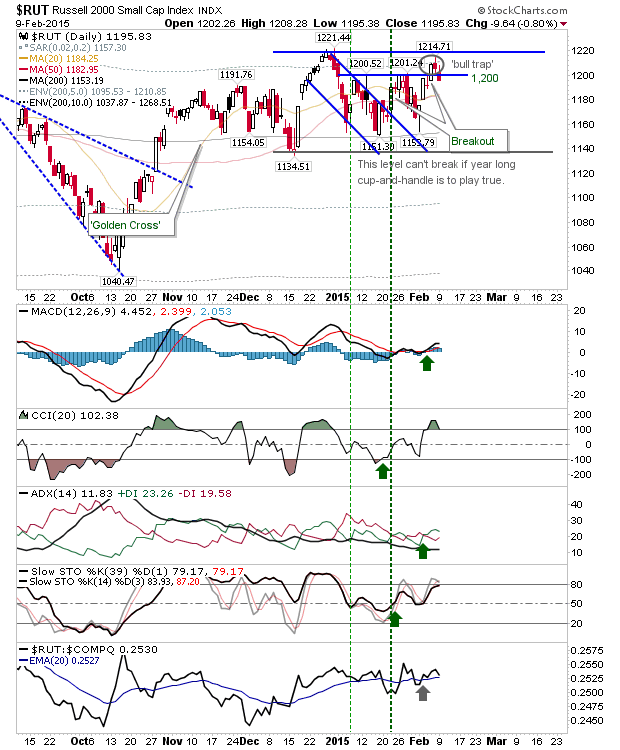
A second day of light losses kept markets relatively restrained. There was some technical change, but nothing too significant to shift the larger picture. The Russell 2000 gave up its breakout in a possible 'bull trap', and this needs to be watched closely if such a move is not to be confirmed with additional losses tomorrow.  Note, this index is still range bound in a 'handle', so the 'bull trap' is not a particularly strong one.

S&P Waits Another Day

Image
After the breakout in the Russell 2000 it had looked like the S&P was ready to follow suit, but Friday wasn't to be its day. The S&P experienced a relatively light point loss, but did register a distribution day. However, it remains primed for a breakout on Monday.

Briefly...

Image
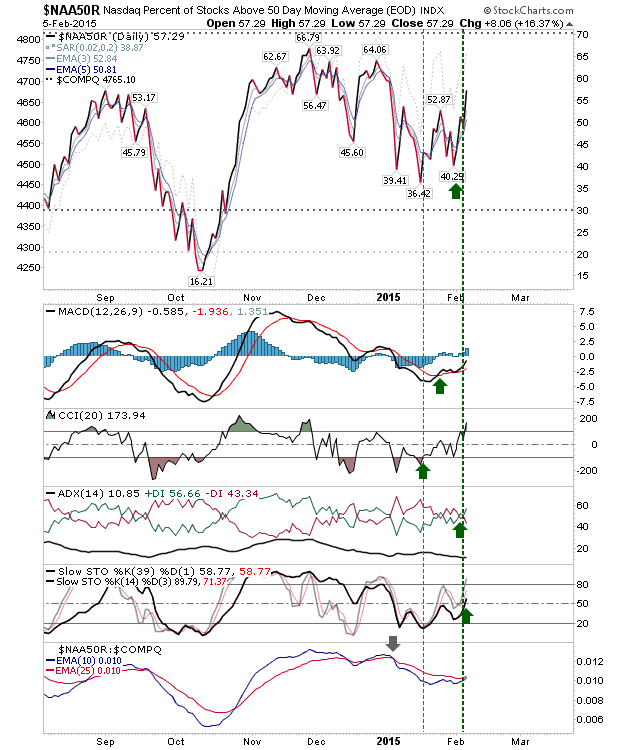
My internet connection is real slow at the moment, so it's taken twice as long to do anything. As a result, I don't have time to take a look at the charts. One chart I am watching closely is the Percentage of Nasdaq Stocks above the 50-day MA. Today saw a net bullish return for technicals, but bulls need this to hold above 50% to suggest they are in control.

Pause Prior to Resistance Challenge

Image
With the swings we have seen since the New Year rolled in, it was no surprise to see small losses today after two good days. This leaves indices nicely positioned to break out of the various trading ranges in play. The S&P has to get past what looks to be strong resistance around 2,064 before it can make a challenge on 2,093. The former might prove to be the bigger challenge than the latter. Technicals are a little mixed, with On-Balance-Volume whipsawing back to a 'sell' trigger.

Range Trading Continues

Image
Very little for the investor, and a market offering high whipsaw risk for intraday traders. All lead indices continue their range bound behaviour, caught more or less in the middle of those ranges. Very little to get excited about until either support or resistance break. The S&P had looked like it was attempting to build a head-and-shoulder reversal within the base, but this now appears to be trading flat out of that pattern, and more towards a base-within-base. A couple of positives are the 'buy' signals in the MACD and On-Balance-Volume, which may favour a push above 2,064 and a challenge of 2,090s. Also, yesterday's gain registered as an accumulation day. While some slowing of the advance on a tag of 2,064 is possible, there is good grounding for some more upside.

Archive

Show more