Posts

Showing posts from February, 2019

Volume selling picks up as prices hold
Image
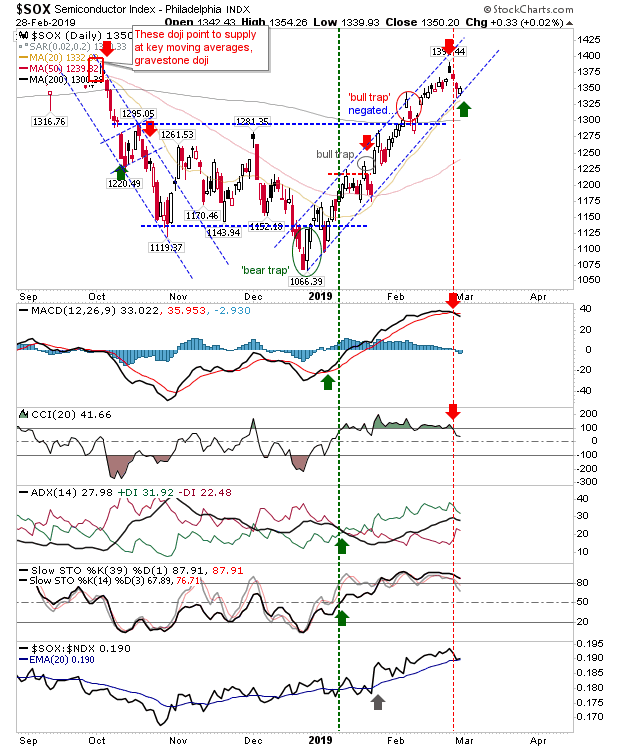
While sellers ticked up their activity there were enough buyers to keep prices stabilized, although supporting indicators have started to slowly rollover.  The one exception was the Semiconductor Index as it started the day at channel support and rallied higher. While the Semiconductor Index rallied off channel support it was left with a 'sell' trigger in the MACD and CCI. Price action is dominant so I have marked a 'buy' trigger at support but use a loss of the channel line as support.

Action Remains Tight

Image
The rally has entered its third month, although the intraday range of the daily bars remains very tight.  There was some weakness today, mostly on the Russell 2000, which reversed off its 200-day MA. The Russell 2000 reversal was a fairly picture perfect move off 200-day MA resistance.  Shorts may want to take a sniff at this as the MACD prepares to trigger a 'sell'. One point to add is that ROC is firmly on the bearish side of the market and has been relatively immune to the gains in price.

Russell 2000 Tags Resistance; Nasdaq Edges Over 200-day MA

Image
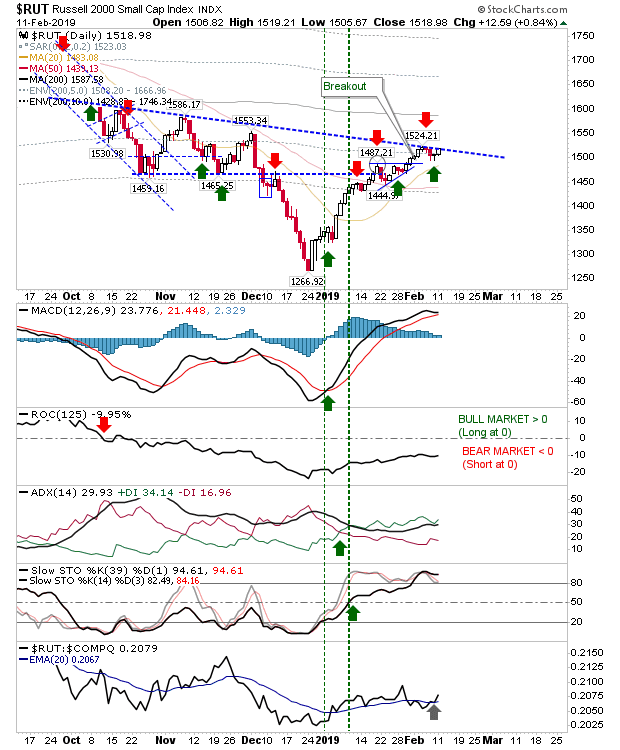
It was another day of small margins but even with this there were still important moves to consider. The Russell 2000 finally achieved what other indices had done a week earlier and tagged its 200-day MA. Other technicals are in good shape but ROC is still in bearish territory but the index is outperforming the Nasdaq.

Action Tightens at Resistance

Image
It's all getting very constricted and narrow at resistance but bears haven't been able to break this extended rally. While I have marked nascent potential short positions at such resistance they remain vulnerable to any decent one-day's gain. Ideally, I would like to see indices drift back to their 50-day MAs but nobody seems willing to blink.

Small Gains Continue; S&P Reaches Resistance

Image
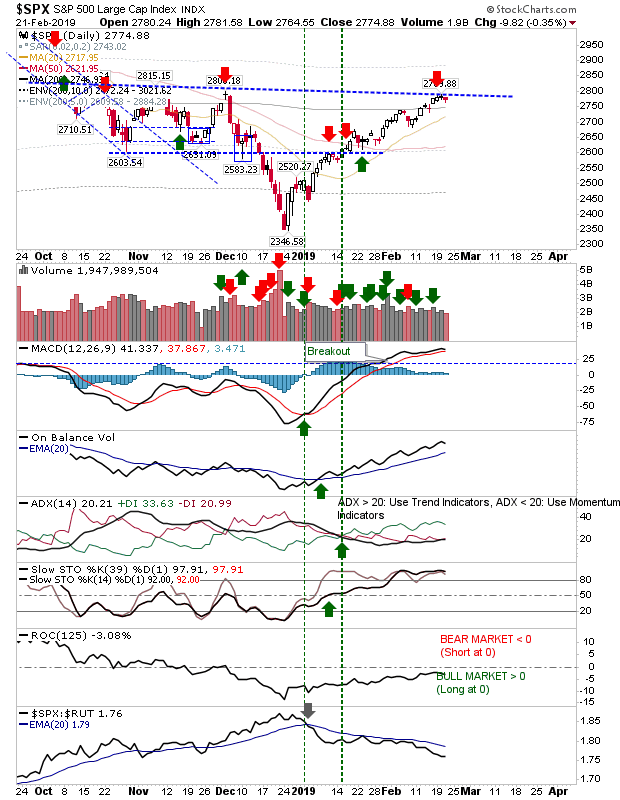
Indices continued to post small gains which left the S&P nestled against resistance. I have marked the S&P as a possible short at such resistance as volume was lighter than usual.

Russell 2000 Approaches 200-day MA; S&P Breaks 200-day MA

Image
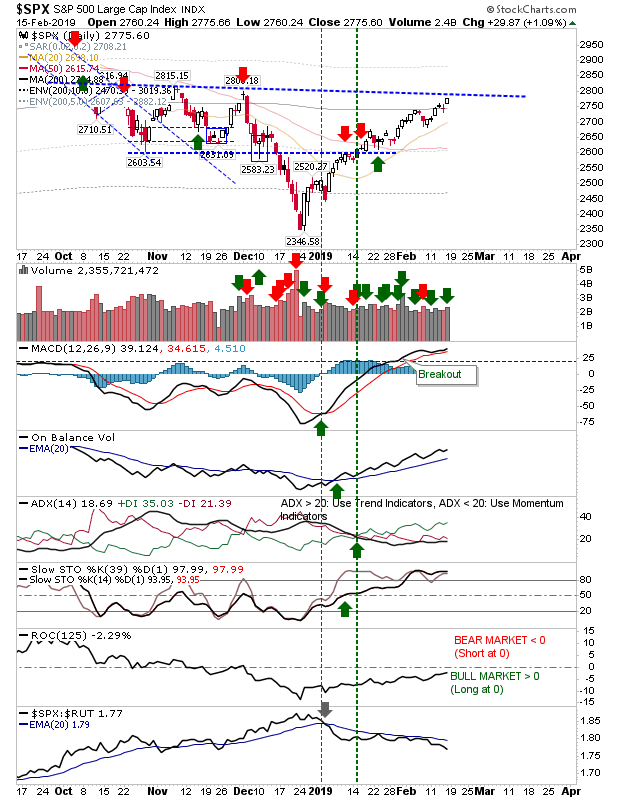
It was another day bulls chalked up a victory and indices posted gains across the board. Some indices did better than others but there is no clear weakness to work off yet. The S&P was able to break past its 200-day MA on higher volume accumulation. However, it's coming up against declining resistance. The MACD has already cleared comparable resistance with new highs which would suggest the S&P will be able to do likewise. Other technicals are in good shape and only relative performance (vs the Russell 2000) is underperforming.

Small gains keep rally ticking over

Image
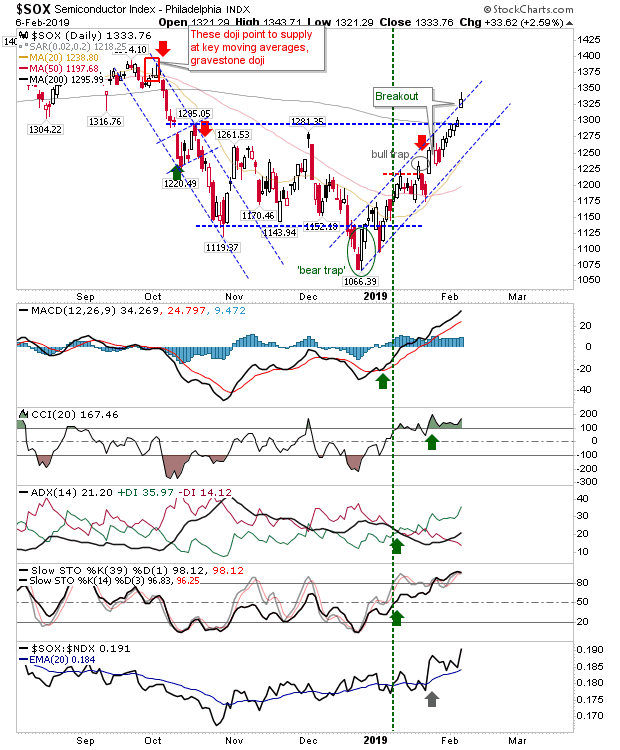
Yesterday delivered small gains which kept the rally chugging along but there wasn't much to add on today's action. Probably the most important action was the break of the 'bull trap' in the Semiconductor Index. The 200-day MA has been comfortably breached and now the index has to work against Fall 2018 supply. This move above the 200-day MA should help the Nasdaq and Nasdaq 100 in their 200-day MA challenges.

Russell 2000 adds a little bullish gloss

Image
There wasn't a whole lot to add today's action as 200-day MAs dominate near term action. The only index which offered a little kicker was the Russell 2000; it posted a small gain which left it nestled against declining resistance. It has the look of an index which wants to break out, but it's not there yet.

Small gains help keep indices near 200-day MAs

Image
Market reversals off 200-day MAs were stalled by Friday's low key buying. The Dow Jones Industrial was the one index which was above its 200-day MA heading into Friday and ended the week with a bullish hammer right on its 200-day MA. The Dow Jones Index had already cleared declining resistance at the end of January prior to breaking through its 200-day MA. To help with 200-day MA support there is the fast approaching 20-day MA. Collectively, there is a potential buying opportunity for a push to 26,300 (the last October swing high), stops on a loss of Friday's low.

Semiconductors kick on as bounce reaches extremes

Image
This bounce which kicked off in December has reached levels which are getting rich for many but not for the Semiconductor Index. The Semiconductor Index gapped higher which keeps it hugging the channel resistance line but also offers a buffer down to support; today's action registered as a breakout. Technicals are in good shape and relative performance is good.

Quiet Friday helped maintain indices breakouts

Image
Friday's action in the indices didn't do a whole lot, but what it did do was help carry last week's breakouts through the weekend. The breakouts were fairly modest and overhead resistance in the shape of 200-day MAs is still a concern for some indices, but last week's action is favorable for bulls. Tech indices were the primary driver last week with the Nasdaq clearing declining resistance with a decent looking breakout on higher volume accumulation; better still is the sharp advance in on-balance-volume - a sign of sustained interest from Big Money to participate in this rally. The Nasdaq does enjoy a relative performance advantage against the S&P, the question is whether it can sustain it.  It still has the 200-day MA to overcome but momentum and short term traders may still be able to eke out a trade on a test of this key long term moving average.

Archive

Show more