Posts

Showing posts from June, 2017

Small Caps Get Their Bounce

Image
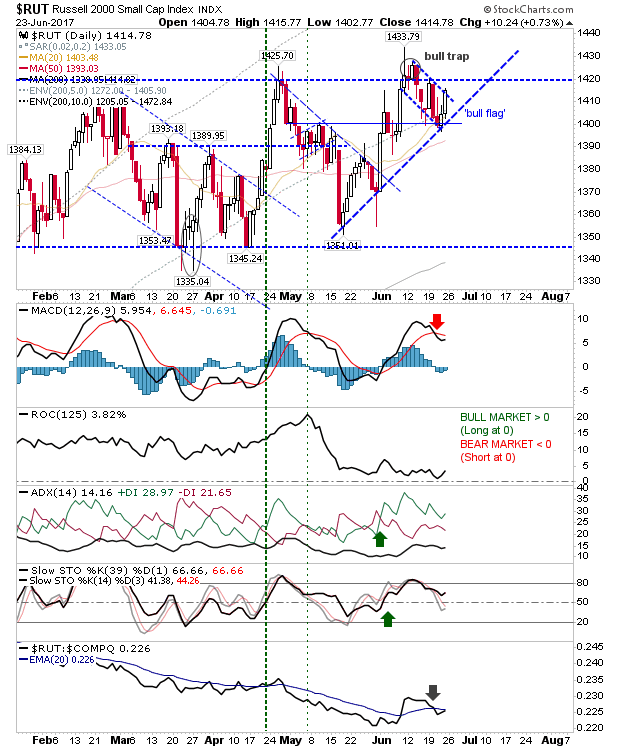
The last few months have seen Small Caps trade inside a lengthy sideways pattern but its moment in the shade maybe coming to an end.  Today's rally in the Russell 2000 was a picture perfect bounce off rising support.  Not only that, it mounted a strong challenge on the early June 'bull trap'.  This improved strength has been represented by the continued uptick in relative performance against the Nasdaq. The next watch area will be a new MACD trigger 'buy' to coincide with a negation of the 'bull trap'.  Once it gets out of the range it will open up for a new round of speculative investing.

Semiconductors Experience Heaviest Loss

Image
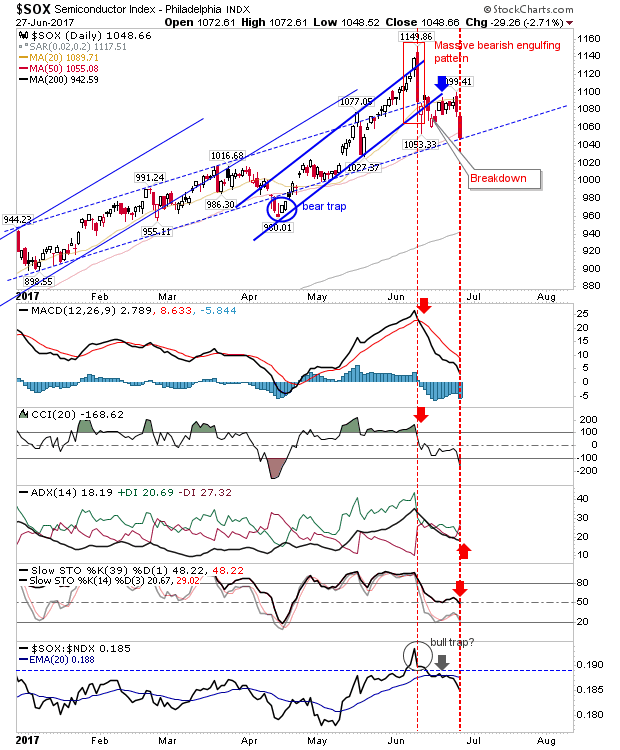
Yesterday's losses followed through with fresh declines on higher volume distribution. Worst hit was the Semiconductor Index as it gave up nearly 3%. Today's finish left it at rising channel support and a chance for bulls to mount a rebound. Technicals are net bearish after stochastics undercut the mid-line which suggests a more prolonged trend lower is in the making.

Worrying Last Hour of Trading

Image
After a bright start from markets with decent gaps higher, bears came in heavy in morning and end-of-day trading to beat markets back below yesterday's close. The Nasdaq closed with bearish cloud cover, a pattern which frequently leads to lower prices the next day. Despite this, the breakout hasn't been violated. The MACD is working to a new 'buy' trigger and rising channel support should offer support if there is some follow through lower - helped by the convergence with horizontal support at 6,170. Don't be surprised if there is a quick push lower to test 6,170 before rallying back to 6,170 by the close of business.

Bulls Put On The Pressure

Image
Markets finished Friday with a little flourish on higher volume accumulation. How much pressure varied between indices. The Russell 2000 rallied off rising support as a 3-week bull flag takes shape. Watch for the confirmation breakout which will coincide with a challenge on the early June 'bull trap'.  I'm liking action in this index.

Russell 2000 at Rising Support

Image
There wasn't much to say about today, but the one index which caught my attention was the Russell 2000. The index caught a bounce in demand at the rising trendline and also did enough to recover the 20-day MA. Traders looking for pullback opportunity could take a look at the Russell 2000. Stops on a loss of 1,397.

S&P Bull Trap on Higher Volume Distribution

Image
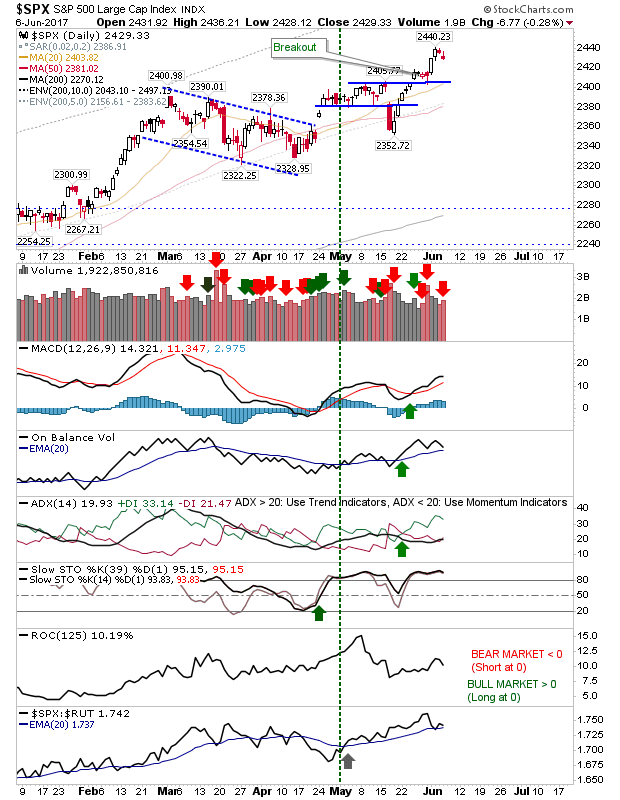
Yesterday's market gains were whipped away on higher volume distribution. This opened shorting opportunities in indices other than the Semiconductor Index. The S&P closed with a 'bull trap' on higher volume distribution.  Shorts could look to a position here with a stop on a move above 2,453. Technicals are still bullish but On-Balance-Volume and the MACD are vulnerable.

S&P Breakout + Tech Support Bounce

Image
If volume wasn't just a little disappointing this would have been considered a super solid day for bulls. Having said that, shorts will be feeling the squeeze and anyone short the Dow Jones would have been feeling particularly aggrieved. Momentum bull-runner the Dow Jones gapped at the open and finished at the high of the day. Relative performance actually dropped a little but the Dow is clawing back 6-months of under-performance so it can be forgiven for this.

Tech Indices Offer Another Chance At Support

Image
Friday saw some big volume trading as options expiration kicked in.  However, there was little change in price action across indices. The Nasdaq and Nasdaq 100 are both in play for Monday, each offering a chance for longs to enter at a combination of channel support and 50-day MA. Technicals are weak, and a move for stochastics [39,1] below 50 would shift technicals net bearish.

Nasdaq 100 at Support

Image
It was a mixed day for markets. The day started with a gap down but bulls were able to make a respectable recovery to finish well yet still net down on the day. The index best placed for a bounce on Friday is the Nasdaq 100.  In addition to finishing on rising channel support the index has the 50-day MA to lean on too. Today's open started at the 50-day MA.  Technicals do not offer much encouragement with a new 'sell' trigger in On-Balance-Volume to follow the existing 'sell' in the MACD.

Potential 'Bull Trap' in Russell 2000

Image
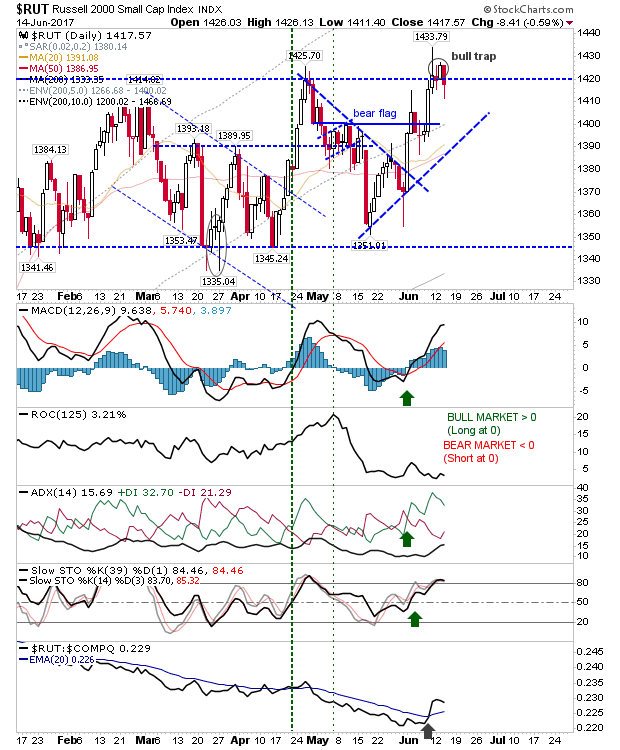
Markets experienced another round of profit taking but there was only one market showing a potential top. Yesterday, the Russell 2000 edged a breakout but today sellers put this in jeopardy with a potential 'bull trap'. The 'bull trap' in the Russell 2000 will be negated on a move above 1,433. Further losses will drop the index back inside the prior consolidation, but 'bull traps' often lead to moves to the other side of the consolidation - in this case, a break below 1,340.

Small Caps Inch Higher

Image
After Friday's selloff, it was left to bulls to try and paint over the cracks. The Russell 2000 returned to its breakout with a small gain over 1,420. The spike high is still influential, but the move into the spike high weakens the significance of this typically bearish candlestick. Also, note the sharp rise in relative market performance against the Nasdaq.

A Bear Market for S&P could only touch 2016 lows

Image
The 'most hated' rally, started in 2009, suffered a potential setback with wide range (neutral) candlesticks across markets. How much the UK election result played on this remains to be seen but Friday's trading marked a day of chaos.  Shorts should not be jumping so much for joy. The rally for the past few months has taken indices to a point where a 25% loss - a definition for a bear market - would only see tests of February's lows in 2016 (and nowhere near a test of 2009 lows or anything later). The S&P experienced higher volume distribution as the day closed with a 'spinning top'. Next week will be about consolidating the action in the context of Friday's close and holding the breakout. Technicals remain positive

(Pre-) Breakout in Russell 2000

Image
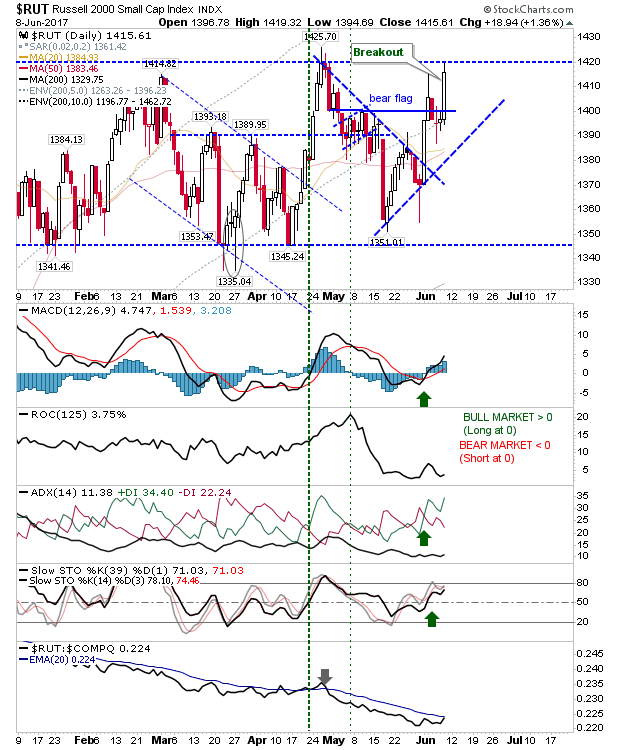
There wasn't much to attract interest but the Russell 2000 managed to stick its head above the parapet with a solid gain.  The Russell 2000 was left just shy of challenging trading range resistance.  Other indices are trading in a tight range which builds tension for a reactionary move; given what's happened in Small Caps, a breakout higher is perhaps favored. The Russell 2000 cleared inner resistance of the 'bear trap' and brought the index to trading range resistance. Tomorrow, watch for a consolidation at 1,420 before the Russell 2000 pushes higher.

Low Key - Healthy Bullish Action

Image
Today was the perfect day for bulls looking for buying opportunities. Markets exhibited small bullish 'hammers' as part of a 3-day pullback; collectively shaping up as bullish flags. As an added bonus, volume rose to register an accumulation day. The S&P pullback will be confirmed on a move above 2,435 with a stop on a loss of 2,425.

Second Day of Profit Taking

Image
Higher Volume distribution took hold in indices but there was no significant point loss to go with the selling. S&P gains posted late last week are holding while breakout buyers have yet to feel the pressure of this week's losses. The surge in S&P relative performance has weakened but hasn't yet pushed a 'sell' trigger.

Markets Build on Breakouts

Image
Two days of gains have pushed markets beyond their breakout levels and new closing highs. Volume has not been spectacular, but shareholders will not be complaining. Shorts will be out or left holding big losses. The Russell 2000 had the best of the action as it negated the 'bear flag' in a move which now looks destined to challenge of 1,425. The MACD is building on its 'buy' trigger but relative performance against the Nasdaq could do with a kicker to mark the return of Small Cap leadership.

Archive

Show more