Posts

Showing posts from January, 2021

S&P breaks rising support, Nasdaq sits on support

Image
I doubt anyone wants to read about anything else but Gamestop stock, but the broader market marches on.   The S&P is trading at its 50-day MA after undercutting rising support on Friday.  There was a break of the mid-line in Stochastics, but technicals are not fully bearish with On-Balance-Volume still to flag a 'sell' trigger.  On a positive note, the S&P is making up ground against the Russell 2000.

Sellers step in to create some distance from recent swing highs

Image
Semiconductors suffered heavy selling which broke support of the rising wedge in a 5% loss. This had obvious knock on effects to other indices such as the Nasdaq and S&P. It's too early to say if this is the start of a major swing high or just a heavier than expected selling day. The key thing from the Semiconductor Index is the gap down from the sell off, breaching support and the 20-day MA undercut. If this is a significant breakdown, then the gap can't be closed (and really, shouldn't be challenged). It's going to take a few weeks for this to recover, even if it does recover. Semiconductors have come a long way in the last five years, but now looks a time for a period of sideways action. 

Prices drift modestly higher on light volume

Image
There was a relatively wide intraday range day for markets, but by the close of business most indices were back where they started.  The biggest gain came from the Nasdaq, but it closed with a doji at a swing high. This is typically a neutral candlestick, but can also mark a reversal. The Nasdaq is starting to run a relative performance advantage over the Russell 2000.

Minor losses for Small Caps offset by small gains for Large Caps

Image
No great change for indices again. There could be an argument for a possible acceleration in the bullish trend for Large Caps and Tech Indices, but its not exactly convincing. On a positive front, technicals are in good shape across all indices. The Nasdaq is in the process of building a relative performance advantage against Small Caps by the acceleration in the bullish trend.

Bullish Trend Continues

Image
What Friday took away, Tuesday gives back. The modest trend which was established in November remains in play. No index challenged its most recent swing high, so really there was no net change in the overall picture for indices. The Nasdaq ($COMPQ) is still holding to its MACD trigger 'sell', but other technicals are net positive.

Friday losses were small but will likely lead to support tests

Image
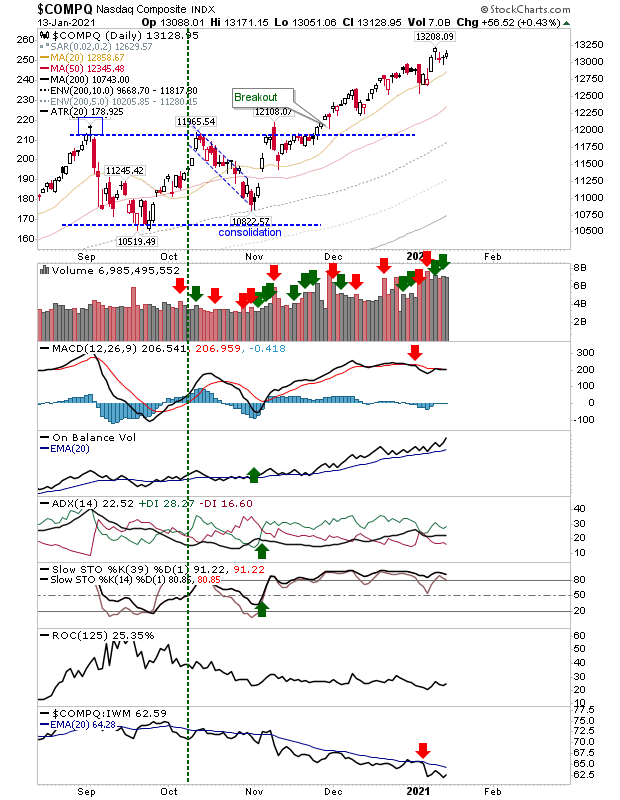
We have a couple of indices likely in the process of testing rising support trendlines. The Nasdaq is running along a support trendline which also closely maps the 20-day MA. 

Gains in Tech and Large Caps don't yet challenge prior swing highs

Image
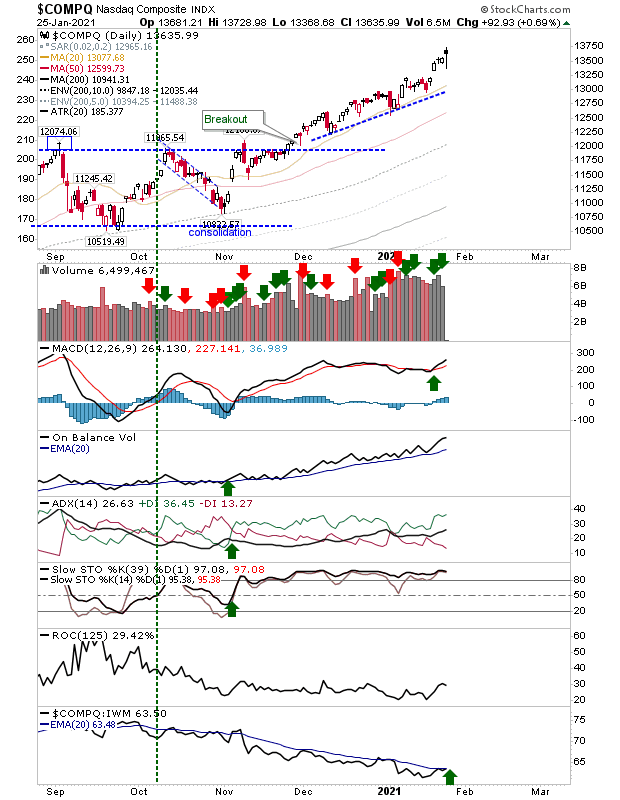
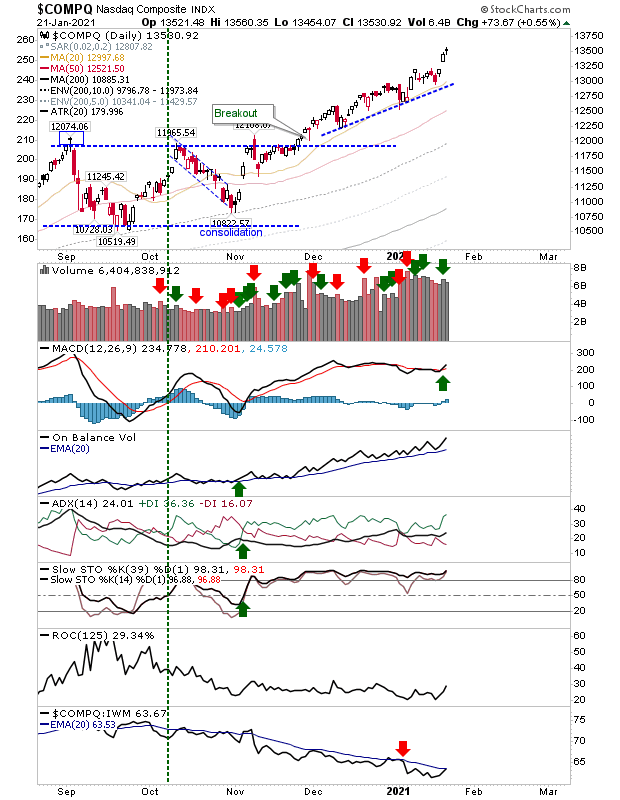
There wasn't a whole lot to today's action. Small gains in the Nasdaq and S&P were unable to return a challenge on the prior swing high, while yesterday's new high in the Russell 2000 saw a minor loss.  Buying volume for the Nasdaq was lighter than normal and there was already a 'sell' trigger in the MACD. In addition, relative performance remained poor.

Minor Losses Keep Markets Near Highs

Image
While markets registered losses of just over 1%, there was no real damage done to the indices. The Nasdaq was one of the worst hit on the day, but the mini push to a new swing high is still intact; the 20-day MA is the support level to watch. 

Good Days Continue

Image
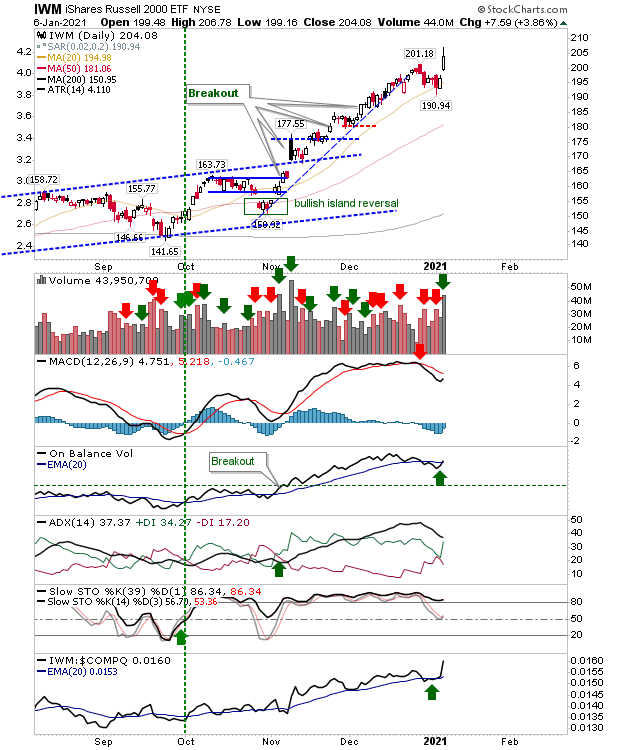
There was a strong close to last week with markets finishing at new highs.  The Russell 2000 was a bit of an exception as it closed just a little down on Friday, but not before spiking at a high.  The Russell 2000 ($IWM) did register as a distribution day on Friday, but the net effect was relatively minor compared to previous buying. Technicals are all net positive with relative performance still doing well against the Nasdaq and S&P.  The index is 36% above its 200-day MA, where just 22% is enough to place it in the 99% area of historic price extremes; a move to mean reversion will happen soon.

Russell 2000 gains nearly 4%

Image
A big divergence in markets as the Russell 2000 wakes from its slumber to close at a new high while the Nasdaq is busy testing its lows. The Dow Industrials joined the Small Caps party, while the S&P was caught in the middle.  It's an odd juxtaposition given the divergence between the indices, with the Russell 2000 so far extended beyond its 200-day MA. Maybe it's the start of a blowoff top, but there was good volume with today's buying - registering it as confirmed accumulation. 

The Year Starts With Selling

Image
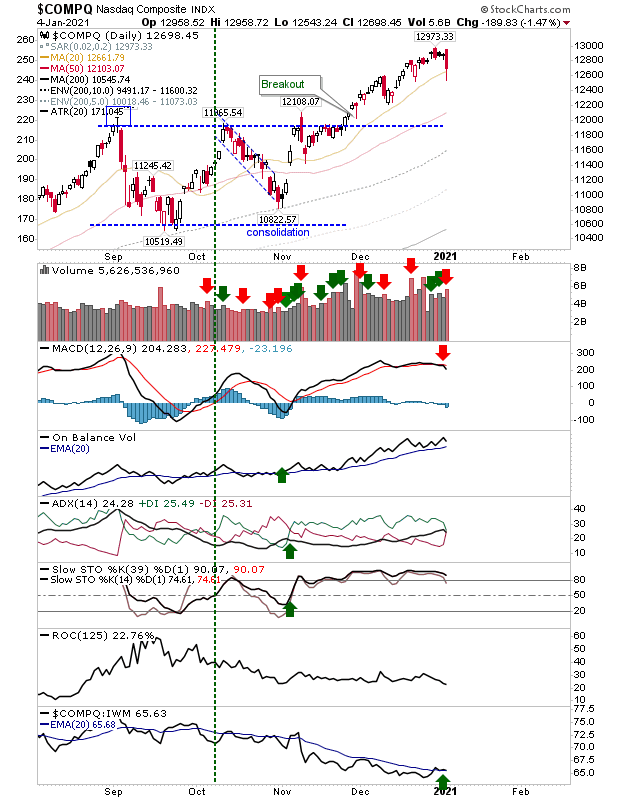
The first day of the New Year starts with selling on heavier volume distribution.  Today may be the start of something, but one day's selling does not make a crash.  For the Nasdaq, we have the MACD trigger 'sell' but still a bullish cross in relative performance to Small Caps. The selling was looking bad but buyers were able to step in at the 20-day MA. 

New Year, Fresh Start

Image
So, as we say goodbye to 2020 - and hello to 2021 - we have a new year to consider and hopefully one where Covid19 becomes a less of news item as the year progresses. But for now, Covid19 (and the consequences of Brexit for those in the UK), is all we have to work with. The Nasdaq finished near its highs but did edge a 'sell' trigger in the MACD. Other technicals are net positive with the index improving in relative performance against the Russell 2000.

Archive

Show more