Posts

Showing posts from February, 2020

Substantial Channel Breaks As Small Caps Hold The Keys

Image
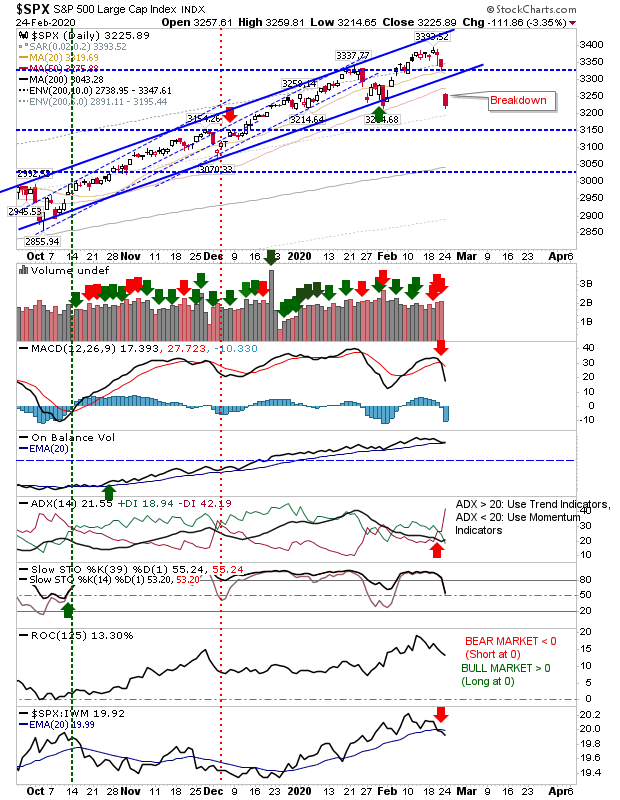
The S&P gapped lower out of its rising channel, following the Dow Industrial Average in its channel break on Friday. The gap pushed below 50-day and 20-day MAs, but it hasn't yet triggered a 'sell' signal in On-Balance-Volume on higher volume distribution.

Dow Breaks Rising Support Channel

Image
The Dow Jones Industrial Average fell outside of its rising channel and into challenging the January 'bear trap'. It's the first of the lead indices to fall outside of its rising channel. Volume climbed to register as distribution with a MACD trigger 'sell', On-Balance-Volume 'sell', and ADX is on a 'sell' trigger. Relative performance remains very weak.

S&P and Nasdaq Recover Morning Losses, Russell 2000 Leads

Image
Volume has eased since markets broke clear of resistance to new all-time highs. The S&P did enough to tag both breakout support and its 20-day MA as part of today's correction. Technicals are all positive although +DI/-DI is on the verge of a bearish crossover.

Market Indecision

Image
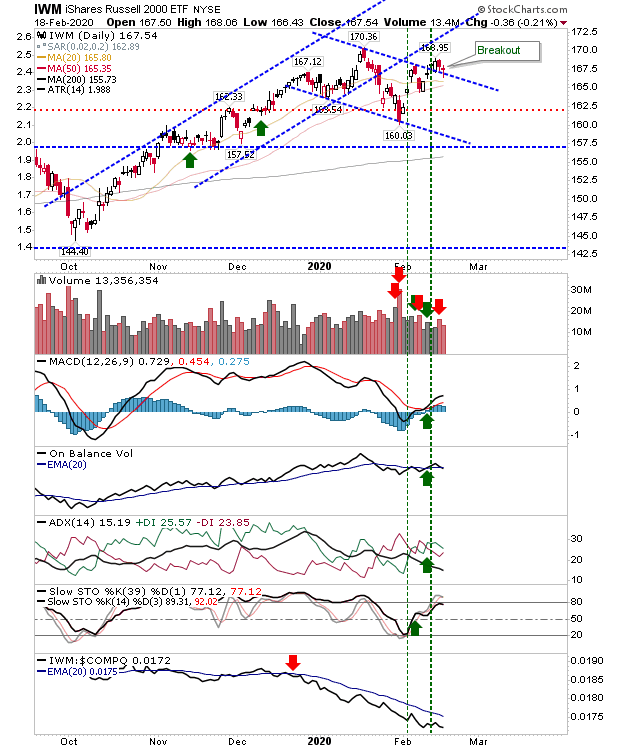
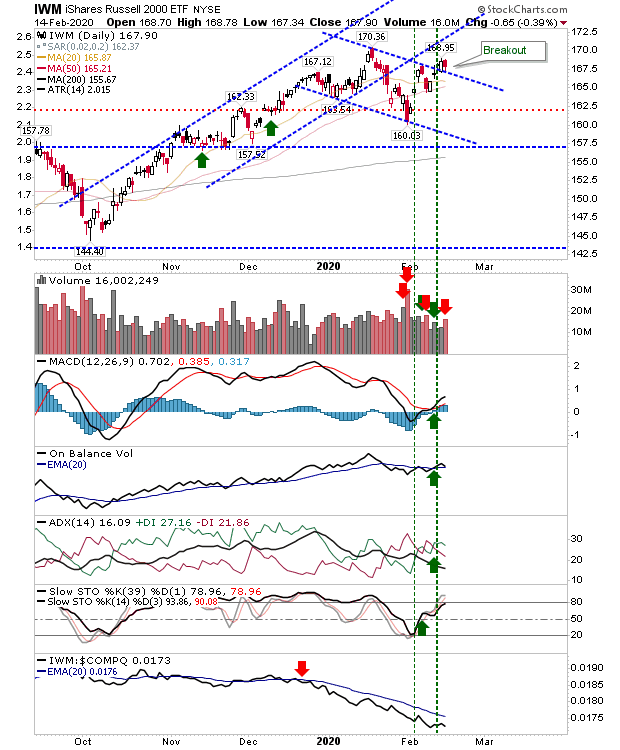
Between's Apple disappointing sale guidance, HSBC's 35,000 employee layoff plan, and lingering Coronavirus, it was looking like markets were heading towards a clear downward session - but this was not the case. Instead, there was a large degree of indecision as existing holders were reluctant to sell but few buyers were willing to step in to defend these elevated prices. On a pure technical view, markets look well positioned for further gains, the Russell 2000 in particular, but the Coronavirus  hasn't yet revealed its full impact on economic supply chains or consumer confidence. The key trigger (for me) remains the Russell 2000. The channel breakout remains valid, even if the index hasn't yet blown past 52-week highs. Technicals are good, although On-Balance-Volume is on the verge of a 'sell' trigger. Relative market performance remains very poor and is a long way from a new 'buy' trigger.
Rallies Defended

Image
There wasn't a whole lot to Friday's action, but the one thing which was important was the successful defense of the Russell 2000 channel breakout. As a bonus, the Nasdaq is running alongside channel resistance and is ready to accelerate higher. The S&P is caught in the middle of its channel and Friday's action didn't change anything. The Thursday breakout in the Russell 2000 gave up nearly 0.5%, but didn't reverse any of the earlier bullish technical picture.

Breakouts Extend

Image
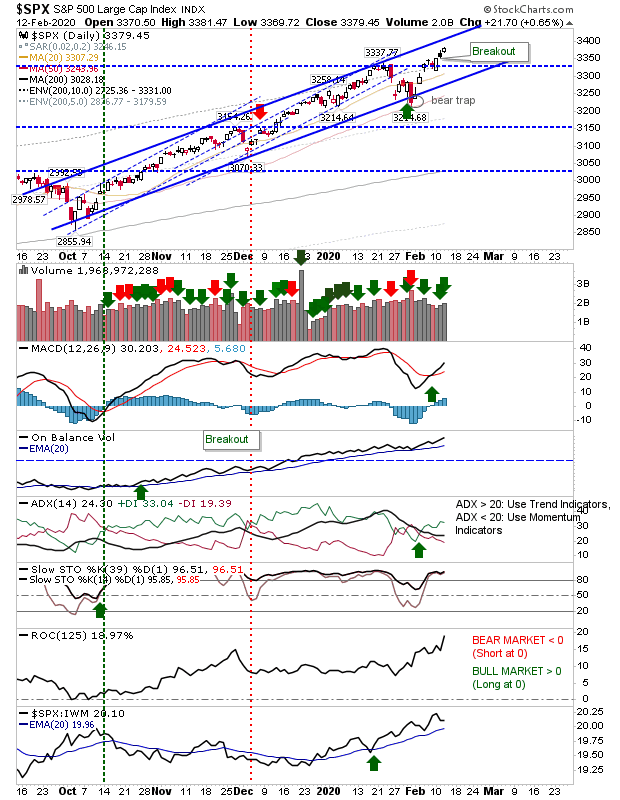
The S&P extended its move above 3,330 resistance on higher volume accumulation. There is still room to run to channel resistance on net bullish technicals.

Tech Indices Follow Through Gains

Image
It was a good day for all markets, but as the Nasdaq was leading other indices with its breakout it was important for this move to hold. It did so with little concern, helping to boost an already strong technical picture. The 90% threshold of historic overbought action won't be reached until the index tags 9,706. However, the Nasdaq has made it to the 85% marker - a point where profit taking and/or selling covered calls should be considered; the last time this occurred was in January 2018.

Nasdaq Holds Breakout with Large Caps Recovering From Bear Traps

Image
Last week didn't see a particularly strong breakout in the Nasdaq but it still managed to hold the move by Friday's close. There was a small uptick in volume, but better was the supporting technical picture; in particular, relative performance against the Nasdaq and accumulation trend in On-Balance-Volume. It's also a counter move against an earlier 'bear trap'.

Bounce Continues With Volume

Image
Buyers worked the bullish harami as a swing low with a second day of buying, this time on higher volume accumulation. Biggest winner of the lead indices was the Russell 2000, but all indices benefited. The gains in the Nasdaq counted as a breakout yesterday but volume was light. Today's gain registered as a bearish black candlestick, with the index closing below its open price. Despite the opening loss, it didn't reverse the breakout. If prices can stay above 9,400 it would complete a return to net bullish technicals with a MACD trigger 'buy'.

Bulish Haramis Attempt to Establish Swing Lows

Image
There was a reluctance on the part of traders to react to the bearishness of Friday' trading, although today's buying came on significantly lower volume. The 'inside day' of Monday's trading ranks as a bullish harami over the last two trading days - a bullish pattern. For the S&P, this buying didn't contribute much to arresting Friday's selling volume as many of the indices failed to recover channel support.  Relative performance remains strong (versus Small Caps) although other technicals are drifting, the MACD in particular.  Some could argue today's buying marked a return to channel support, but it's not a substantial recovery.

Indices Break Channels

Image
Friday was a return to the selling which started the week; the Monday gap down and Friday's selling bound small gains into the gap. Friday's selling also brought with it channel breaks across many of the indices. The S&P closed at its 50-day MA, at a point where the potential 'buy' signal from earlier in the week is now under pressure from a stop-out if the 50-day MA is breached. Technically, there was an acceleration in the MACD trigger 'sell' and an ADX 'sell' trigger, but offset by an acceleration in the relative performance against Small Caps.

Archive

Show more