Posts

Showing posts from January, 2016

Counter Break of Consolidation

Image
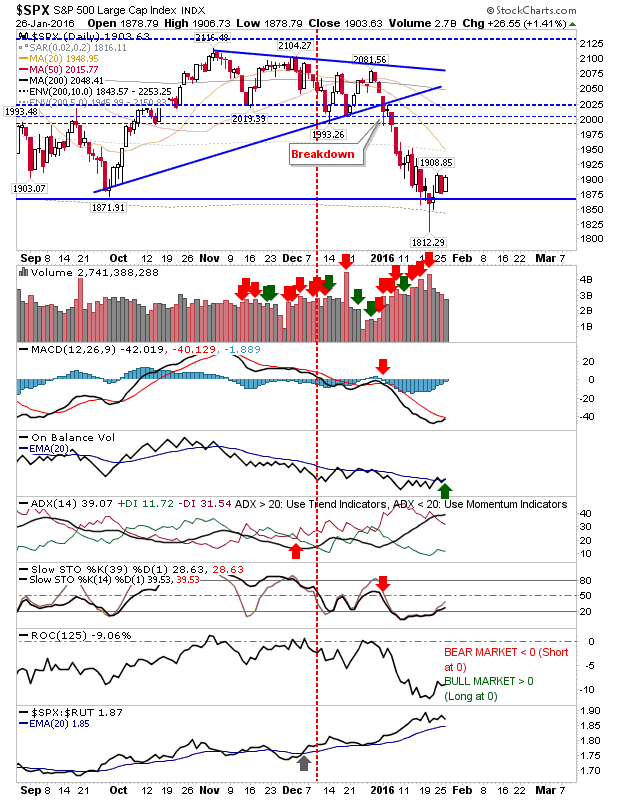
Markets were setting up for a push lower, but Friday's upside break from consolidations triggered a wave of buying (and short covering). The buying was accompanied with higher volume accumulation. Shorts were left squealing by Friday's action, and new shorts will need to wait until Nov-Dec consolidations are tested before new positions are entered. Until then, short covering and long buyers rule the day. The S&P has taken the first step of a rally to take it back to the supply zone of 2,000. Friday's action was accompanied by a MACD trigger 'buy' and On-Balance-Volume 'buy' trigger.

Market Consolidations Continue

Image
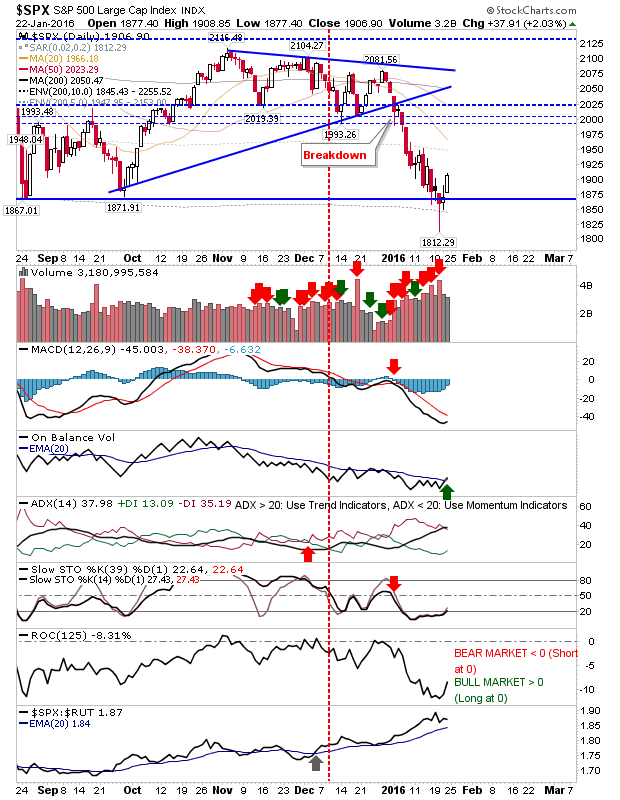
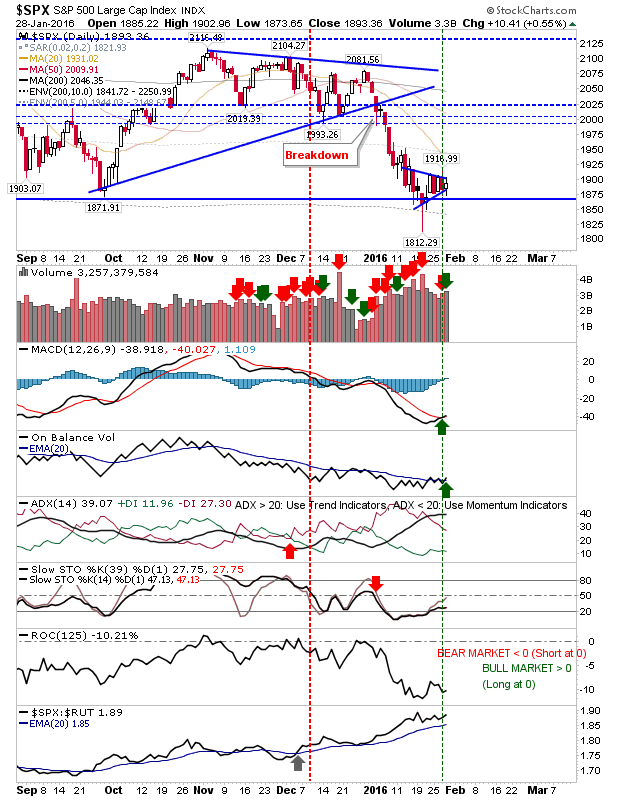
The consolidations developing in the market remained in play by the close of today's business. Volume climbed in confirmed accumulation, which is a potential sign for an upside breakout from these consolidations. But with bearish lead-in trends, any upside breakouts will quickly run into supply issues from Christmas consolidations. The S&P is shaping a pennant just above support from September/October swing lows. There is a weak 'buy' in the MACD and On-Balance-Volume.

Consolidation at Support Suggests Breakdown Favoured

Image
The back and forth in the markets continued as yesterday's gains were undone by today's higher volume selling. The concern with today's action is that the consolidation in the S&P has the look of a bearish continuation wedge. And given the potential for a measured move, it opens up the possibility for a push down to 1,650s. A weak 'buy' signal in the MACD could trap more bulls.

Good Recovery

Image
Monday's close had all the look of a retest of last week's spike low. And the Asian session only looked to confirm further weakness as the Chinese market continued its slump. However, bulls kicked off from the open and clawed back most of yesterday's losses. In the end, markets are nicely placed for tomorrow, having undone the damage of yesterday. The S&P still has a 100 point buffer before it gets to supply issues.

Friday's Gains Reversed

Image
Start Here You've now read my opinion, next read Douglas' and Jani's . It looks like longs weren't prepared to wait for a test of Oct-Dec trading ranges before dumping their positions. Instead, longs took advantage of nascent strength to sell existing positions. If there was a bullish take from this, then it's that selling volume was lighter, which may give bulls something positive to hold on to. What today's action suggests is that a move back to last Wednesday's spike lows would appear to be necessary to firm if support - if such support exists. Unfortunately, such a test would break up September's low as trading range support, and open up the possibility for a measured move lower (i.e. the height of the Sep/Oct - high/low differential, projected lower).

Nascent Swing Low

Image
Friday did enough to confirm Wednesday's spike low as a potential Swing Low. Markets may look to rally back into the Oct-Dec trading range, but getting beyond that may prove more of a challenge. But until then, is plenty of room to support a low volume rally. For the S&P, there is a thick level of support from 2,000 up to 2,025. Beyond that, things quieten with the 200-day MA, then a successive level of swing highs. Technicals remain in bears favour, although there was a 'bull' cross in On-Balance-Volume.

Capitulation?

Image
Today offered the first real sign some form of capitulation kicked in. Volume was perhaps a little tame (although higher), but markets have reached a point where a short term bounce could be in the making. What may be of greater interest is what happens once we confirm a bounce is in effect. I suspect buyers will be reluctant to push prices beyond the November/December swing lows. The Russell 2000 is the index which has suffered the greatest losses over the past few weeks and it was the first index to finish with a gain. The bullish 'hammer' is a bonus and today's intraday range included the 25% loss from all-time peak to current day lows. We have long since passed the period of historic weakness relative to its 200-day MA (deep inside the 5% zone of historic weakness).  While today doesn't feel like a low-low (only a hunch), it's still likely to mark a trade-worthy low, much like August's and September's lows last year.

Small Caps Continue To Feel Pain

Image
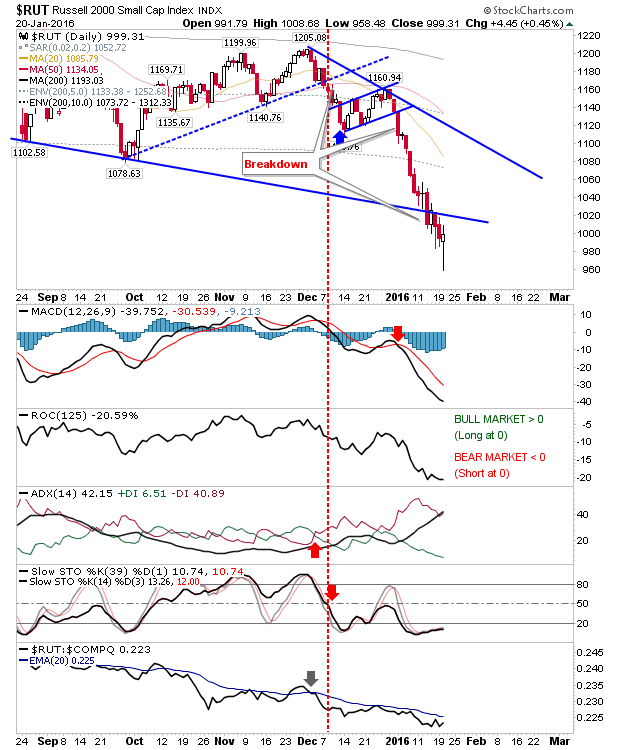
It was an odd day. Early gains were quickly erased, but some markets managed to regain some lost ground by the close. The Russell 2000 experienced the worst of the action and is finding it hard to attract buyers. The next milestone is the 25% discount from highs at 972, then the measured move lower at 951.

First Derivatives Seeks New Hires

Image
If there are readers out there looking for a change in scenery in their jobs, First Derivatives (my employer), are looking for candidates.  They have offices in the U.S., Ireland, U.K., and Australia. If interested, I can refer you to HR if you send on your CV to me, and an email detailing what role you would like to fill and why to dfallon(@)firstderivatives.com The available roles i n summary are: London / New York/ International Based Roles ·         Java Developers ·         C# Developers ·         Vendor SME’s – Murex, Calypso ·         Business Analysts / Technical Business Analysts ·         Programme/Project Managers ·         Experienced Support Analysts ·         Test Analysts Newry / Dublin/ Belfast Based Roles ·         Business Analysts / Technical Business Analysts ·         Experienced Support Analysts ·         Client On Boarding ·         Test Analysts ·         Java Developers ·         C# Developers The company website is her

Markets Down But Volume Picks Up

Image
What had looked like a swing low on Thursday was quickly undone in early action Friday. While traders looking to trade a short term bounce were burned, those looking for long term opportunities were rewarded with further discount. There wasn't any change in the long term bottom watch. The S&P almost reached the 5% percentile of weak prices, last seen in November 2011.  Likewise, the Nasdaq is close to the 10% percentile, while the Russell 2000 is already in one of the weakest periods it has experienced since 1987. This doesn't mean prices can't go lower, but if you have a hold time period of years there is value to be found in Small Caps stocks. The last time markets were this oversold was in 2011, and 2008 before that.

Better Action From Bulls

Image
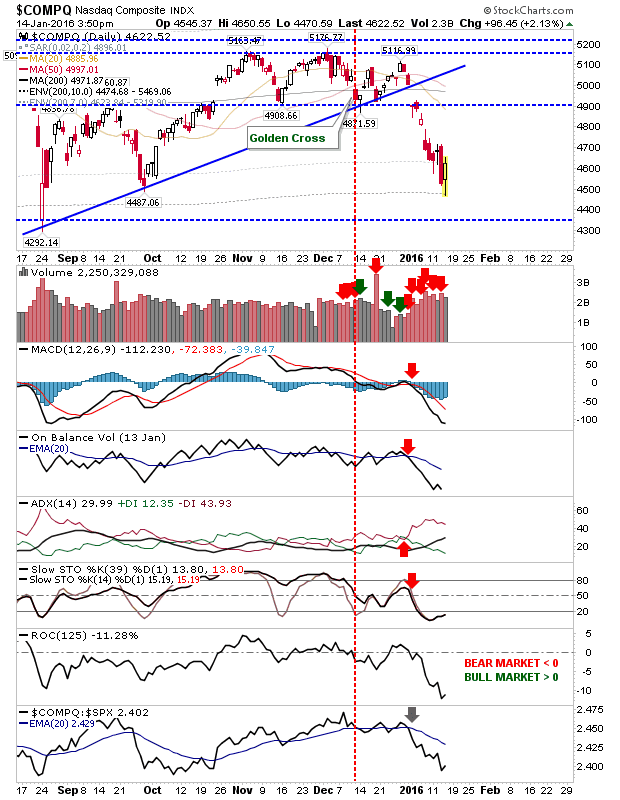
After yesterday's finish it looked easier for markets to continue lower, and early action had suggested this might have been the case. A weak finish put a bit of a damper on things, but there is something for bulls to work with. Volume didn't register as accumulation, which was disappointing and would have helped defining a capitulation - which doesn't look to have happened yet. The Nasdaq had the best of the action. A bullish harami after new lows offers a suggestion for higher prices tomorrow. The problems for bulls will start if the index makes it to Oct-Dec congestion zone and/or overhead moving averages.

Sellers Strike Back

Image
Where for most of 2015 bears often found themselves on the back foot with days of selling undone by one big buying surge, now bulls are finding themselves having to step up at a time when shorts are in control. Today was an ugly day. In terms of relative performance, the S&P has dropped into the 10% percentile of bearish prices dating back to 1950. There was little positive to say on the day. Given the rate of decline, the chances for August/September lows holding as support look slight.

Bulls Attempt A Defense

Image
It wasn't a decisive victory for bulls, but at least buyers were able to push markets into a higher close. For some markets, the end result was still indecision as to whether this marks a potential swing low. And in all markets, volume was lighter than yesterday. The Russell 2000 was the index which had taken the biggest relative loss, and consequently, had the most neutral finish with a wide-range day doji. There was a small uptick in technical strength, with the exception of relative performance against the Nasdaq (and S&P), which ticked lower.

Markets create spike lows

Image
It was a mixed bag for markets.  Large Caps probably had the best of the action; the Dow closed a little higher while the S&P pushed a spike low. The S&P did tag the 10% percentile of historic low prices going back to 1950, while technicals remain firmly negative. Today's doji marks indecision and makes tomorrow a 50:50 play. Should markets continue to fall then August/September lows will appear to be a minimum test.

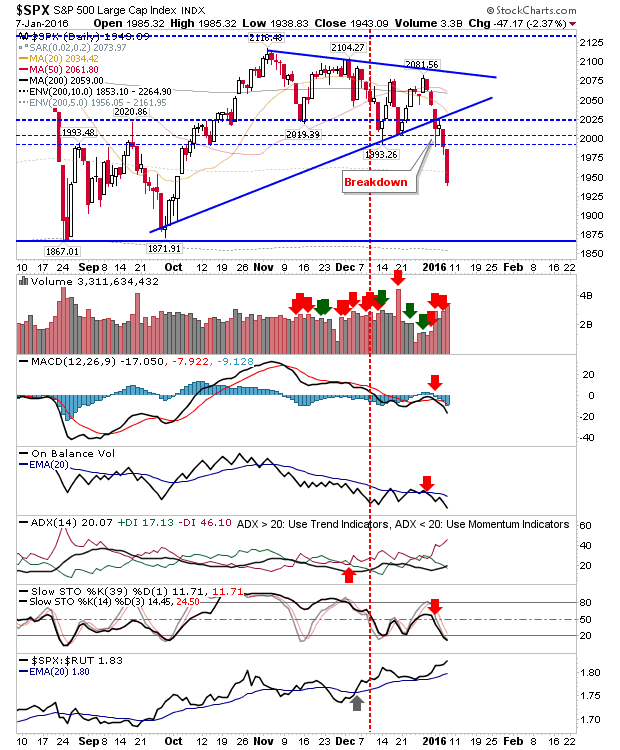
Markets followed Thursday's sell off with another round of selling on NFP day

Image
An ugly day for bulls pushed what was already an oversold market into deeper state of weakness. Short term traders will be looking for a bounce as markets speed their way to August/September lows. One index has already surpassed these levels. The Russell 2000 is in the 90% zone of historic weak prices going back to 1987 and is well beyond September lows.

S&P in 15% Percentile and Russell 2000 in 10% Percentile of Historic Weakness

Image
It was another day for bears to tighten the squeeze. For the first time in 2016, having recently tagged such levels in August/September 2015, the S&P returned to the 15% percentile of historic weak prices dating back to 1950. The index is firmly on course to retest the aforementioned August and September double bottom, when the S&P went as far as to hit the key 10% loss below its 200-day MA. This period of weakness is not unusual for the S&P. And a drop to 20% below its 200-day MA sometime this year, and possibly next, would not be unreasonable - as the table below illustrates:

Losses Continue

Image
After yesterday's brief lull, sellers continued to push markets lower. In the context of August/September lows, today's action was modest yet unwelcome. The S&P finished below 2,000, leaving just August and September lows as next support levels. Intermediate Stochastics are not oversold, which may yet see another couple days of downside before a relief rally kicks in.

Little Change in Markets

Image
There was to be no follow through as US markets survived the Asian session. It was a relatively calm day with markets heading into NFP data at the end of the week.  What was said yesterday remains true today: markets lost support and are in a battle to retain it. The S&P managed to close a little higher, but the question of overhead supply remains.

Chinese Hangover

Image
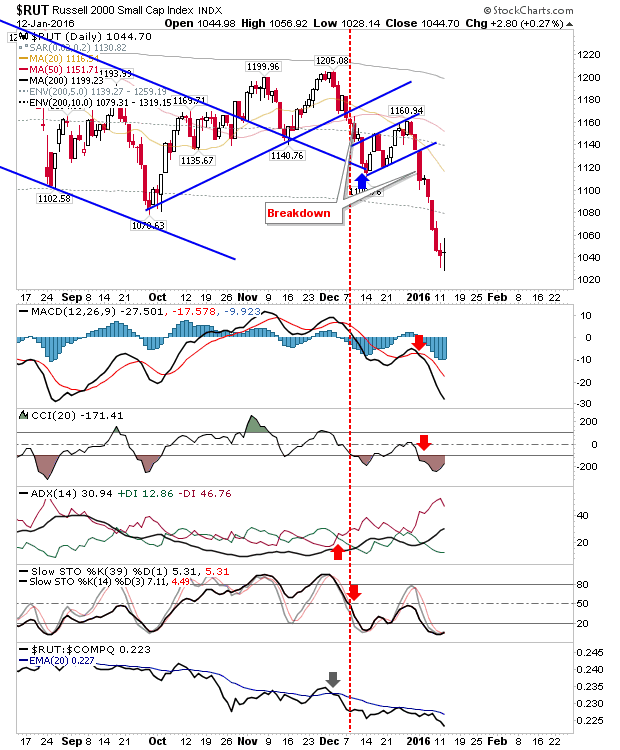
Heavy losses in Chinese markets were going to make it difficult for bulls to defend support when U.S. markets opened.  There was some clawback into the close of business, but substantial gap downs remain.  Volume also climbed in confirmed distribution, another tick in favour of bears. The Russell 2000 followed with a break from its 'bear flag', although it would have been impossible to have benefited from the open.  A retest of October lows would appear to be a minimum test, but a new MACD 'sell' trigger below the bullish zero line suggests worse is to come.

Year Ends With a Whimper

Image
The year closed out much as it started with 2015 offering very little for either bulls or bears. The 'Santa Rally' never really got going, and while traders could still kick start a rally for January there will be doubters. The sequence of lower high and lower lows in lead indices suggest controlled distribution, which places pressure on marked support. The Nasdaq will start the year testing such support. The final day of the year registered with distribution, despite relatively light volume.  There was a 'sell' trigger in On-Balance-Volume, although there is no discernible trend in this indicator to suggest a favoritism towards bulls or bears.

Archive

Show more