Posts

Showing posts from November, 2020

Russell 2000 sees some selling

Image
There wasn't too much damage done to the gains made on Friday's junior trader watch. Volume was up significantly across indices to register today as a distribution day, but the relative price loss was small.  Only action in the Russell 2000 left a mark on the chart. Even with the selling in the Russell 2000, it remained well above breakout support and held a significant performance advantage relative to the S&P and Nasdaq. Technicals remain favorable with no major bearish divergences to be concerned with. 

Nasdaq and S&P make key gains

Image
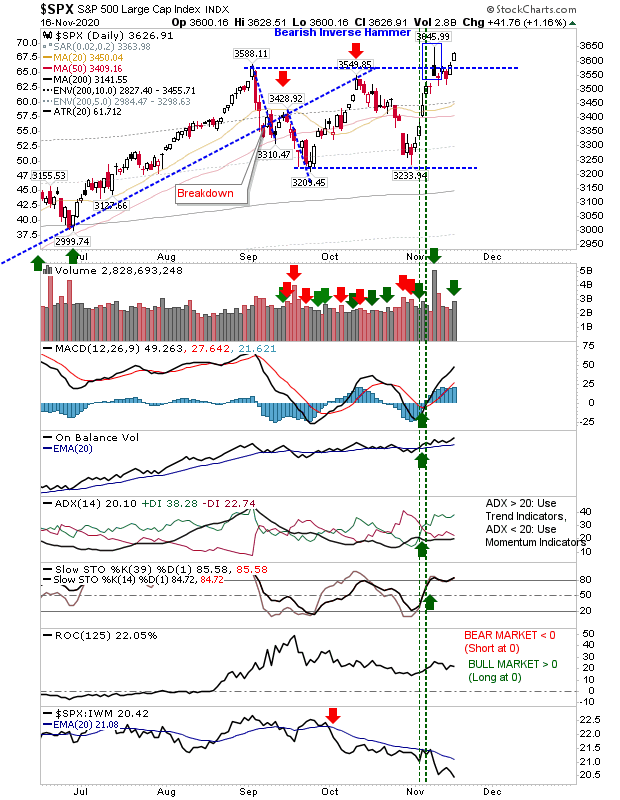
Important day for the indices with the S&P again pushing into the spike high of the Bearish inverse hammer. Volume climbed to register an accumulation day as buyers found some footing on the back of bullish net technicals.

Russell 2000 Holds Gains

Image
There wasn't a whole lot of change to the week for indices but it was good to see the Russell 2000 hang on the gains generated by Monday's gap higher. Better still, it looks to have killed the bearish implications of the previous week's bearish black candlestick. All we need now is some follow through higher, helped by some strong technical support - including excellent relative performance.

S&P and Nasdaq Again Can't Get Past September Highs

Image
Why the focus on the September highs? Because they came with extremes in breadth metrics for the S&P and Nasdaq - marking levels typically associated with a major top. The action from Monday had looked like it was going to end the consolidation established from the September peak but again it was not to be. Today is not the start of a crash, but it is disappointing.  The S&P is back at breakout support on the back of heavy volume distribution. The loss added to the relative loss against the Russell 2000. While today marked a loss, the presence of support hasn't totally negated bullish opportunity. 

Indices Recover Lost Ground

Image
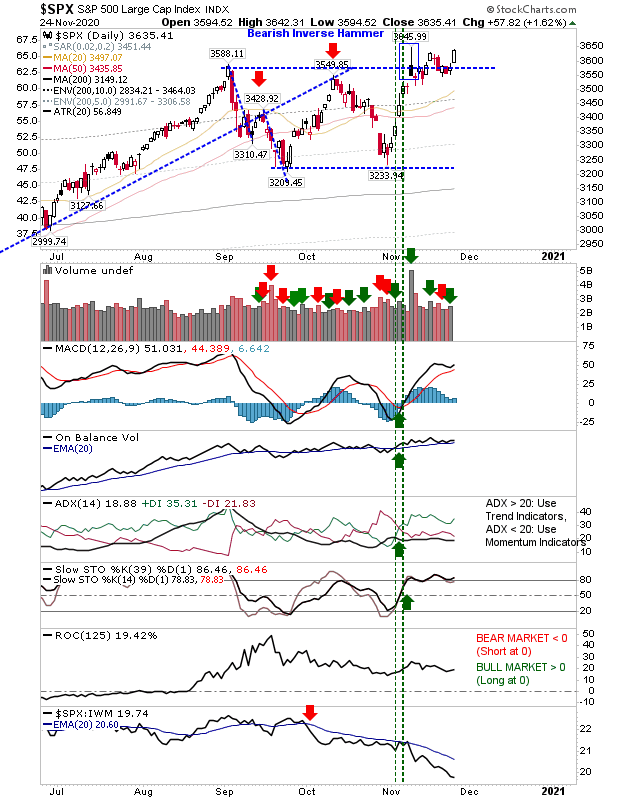
Another bright start to the week on more positive Covid19 vaccine news. Today's gain was accompanied with higher volume accumulation across indices, setting them on course to negate the ultimate bearishness of last Monday's candlesticks - despite the initial positive vaccine news then.   For the S&P, while today's gains pushed it well inside the spike high of the inverse bearish hammer, relative performance against the Russell 2000 took a big step lower. Under these circumstances, this may be seen as bearish but Small Cap leadership is critical to the success of any long term bull market. We will have to wait and see what the rest of the week brings. 

S&P Starts Challenge on Spike High

Image
I've mentioned the importance of Friday's close on the Russell 2000 here , but the S&P finished the week doing its own thing as it worked to reverse the dominant bearish inverse hammer. This particular candlestick is of particular concern, not just because of the pattern but the huge volume which went with it. However, the end of week finish was positive as the index was able to poke its head into the spike high of the inverse hammer. 

Selling weighs heavily on markets

Image
Markets yet to deliver on fresh breakouts as they linger near resistance but they are making heavy weather of it. Triple tops are rare patterns and the Russell 2000 is signalling a breakout but hasn't quite done enough to confirm it yet.  Technicals for the Nasdaq are bullish with the exception of relative performance to the Russell 2000. 

S&P and Nasdaq can't break September swing high

Image
It was another struggle for the S&P and Nasdaq as they tried to get past the swing high of September. Only the Russell 2000 is showing signs of relative and price strength, which is good, but broader participation is required if those gains are to stick.  The Nasdaq has fallen inside the prior trading range established from September. While triple tops are rare we are looking at the possibility of one here. Today's bullish 'hammer' may offer a launch point to challenge the bearish engulfing pattern high - which would be enough to restate a breakout.  Not surprisingly, there was a large drop in relative performance to the Russell 2000. 

Waiting On Russell 2000 Leadership

Image
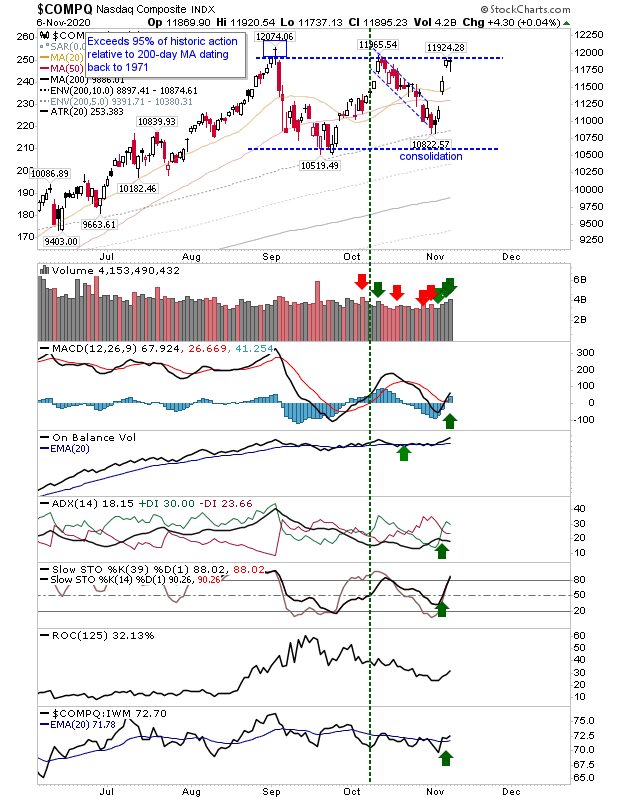
The Nasdaq looked like it was going to breakout on Friday and take out the key swing high from September. It wasn't able to do so then, and it may do so Monday, but until then we have to wait-and-see. Volume action is healthy with increase buying and net bullish technicals. 

Recent Buying Remains Range Bound

Image
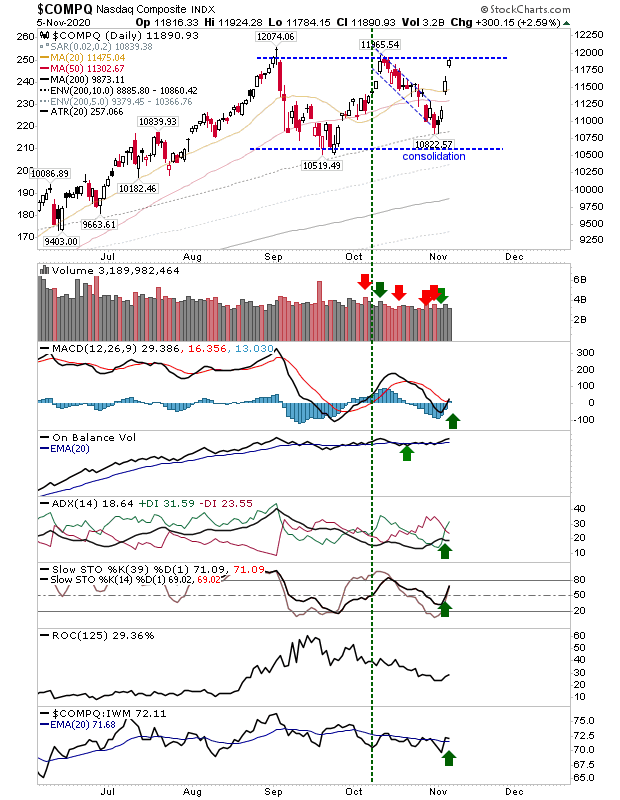
Election week buying has managed to undo much of October's selling, but for all the enthusiasm it doesn't change the broader consolidation which is an index caught between Autumn peaks and swing lows. Technicals for the Nasdaq returned to a net bullish picture but the index now finds itself back at - what had looked to be - a double top. As J.C. Parets has noted, how many times do you see a triple top? Not very often, so we must consider this test of resistance is part of a larger move higher. 

Market Bounce Attempts To Firm Lows

Image
Buyers made a return to markets before heading to the polls. There wasn't a whole lot of volume to today's action but it was enough to mark the action of the previous few days as a possible swing low.  The S&P was one of the stronger indices in its reaction off support. However, it now finds itself coming up against resistance of its 20-day and 50-day MAs. On a positive front, there was a 'buy' trigger in On-Balance-Volume, albeit a weak signal from a flat-lined trend. Relative performance was skewed heavily away from Large Cap stocks. 

S&P Tags Consolidation Support - But Will It Hold?

Image
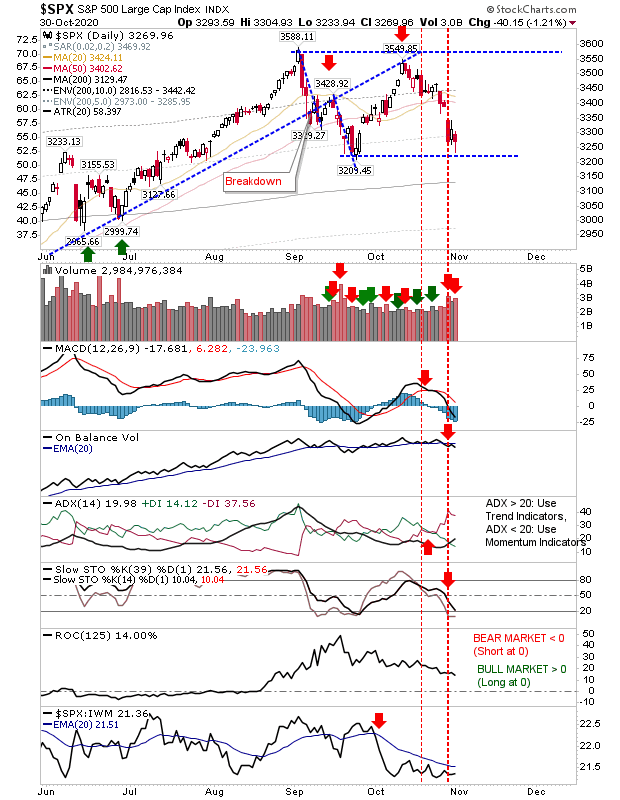
With the election fast approaching we see the tension express itself in the market with an increase in volatility.  The direction of the popular vote may be known, but its hard to see the result on Wednesday as been considered final - at least as long as Trump doesn't win. The vote will tighten on Tuesday and only a blowout will prevent the legal wranglings to follow. None of this makes for comfortable reading for the market, and this uncertainty is coming to a head. The September bounce has faded, but the S&P is able to find support support at the September swing low, suggesting buyers are willing to step in to support the market. Friday's selling marked itself as confirmed distribution, so while there are buyers it may yet be sellers who take this beyond support and maybe into a test of the 200-day MA.  Technicals are all net negative, including what looks to be a trend reversal in on-balance-volume after a summer of accumulation. 

Archive

Show more