Posts

Showing posts from August, 2022

50-Day MAs tagged - now let's see what happens...
Image
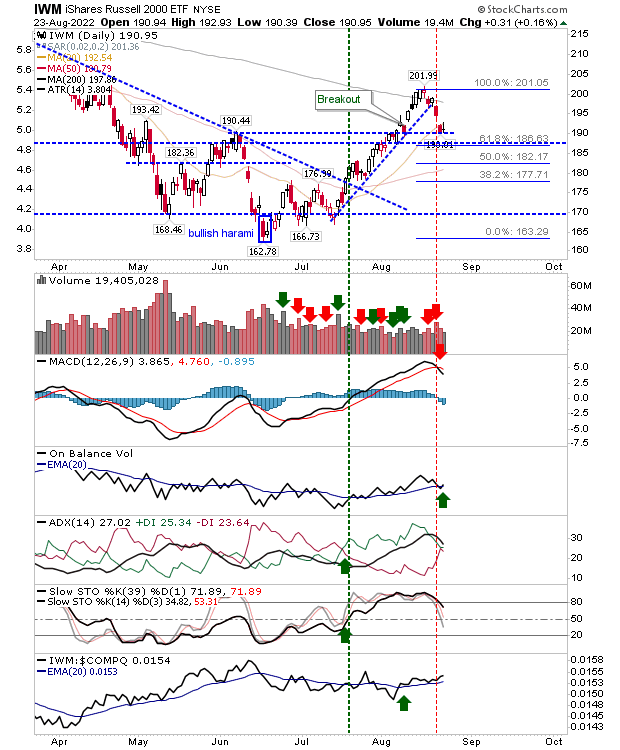
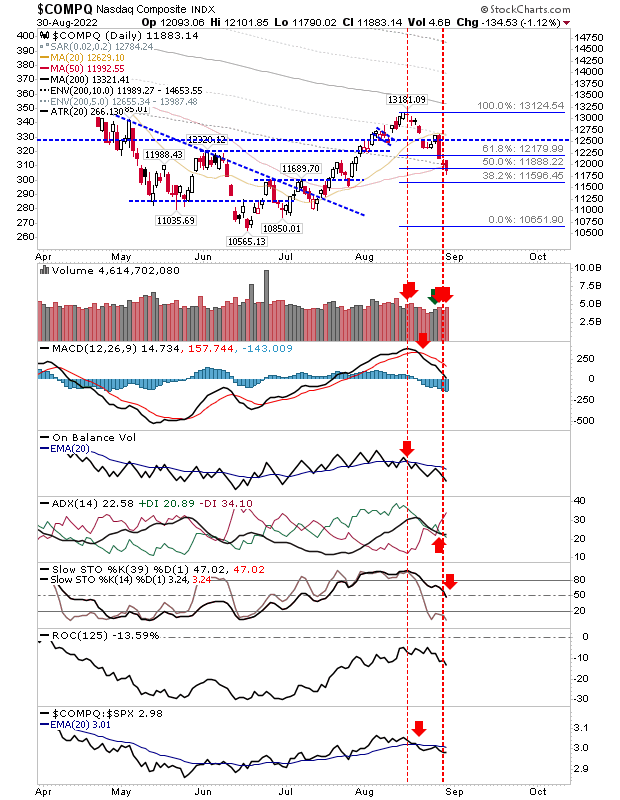
I've been looking for these tests of 50-day MAs since the reversals off 200-day MAs.  These tests have coincided with moves into 50% Fibonacci levels which increase the possibility of support kicking in.  While the tests of welcome, the 'how' of these tests is less so. Ideally, I would like to have seen more bullish candlesticks, but this was not the case. The Nasdaq had a standard bearish sell off on confirmed distribution, with the added trouble of a return of net bearish technicals. If I had a preference, it would be for a 'bullish'  hammer with a close above today's close. 

Zig-zag correction to test 50-day MAs for S&P and Co.

Image
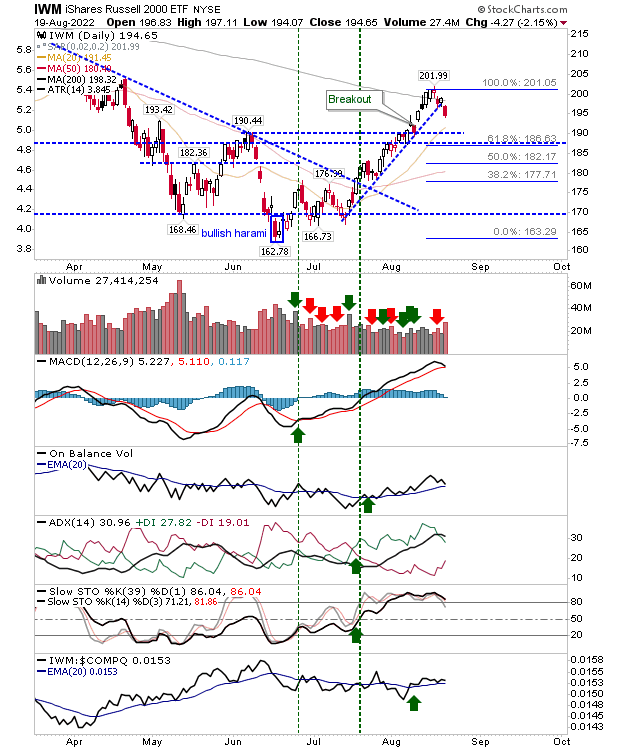
There was no doubt which side had control of markets on Friday.  Bears stepped in and sold stock in volume on Jerome Powell inflation comments. Futures remain testy heading into Monday so we have to re-consider the outlook for the markets.  I had thought last week's mini-rally was coming a little early with a preferred move for 50-day MAs test as part of a move into Fibonacci retracements (for the move off June lows).  Friday's selling did bring markets into the upper levels of the Fibonacci retracement, and with weak Futures, we could see 50-day MA tests early next week. The Nasdaq was the weakest index heading into Friday and suffered the biggest percentage loss on the day. There was no surprise to see distribution control volume with ADX moving to a new 'sell' in line with 'sell' triggers in On-Balance-Volume and the MACD.  The index continues to underperform the S&P.  I would be looking for the Nasdaq to test its 50-day MA first, which would be an ideal

Early Risers

Image
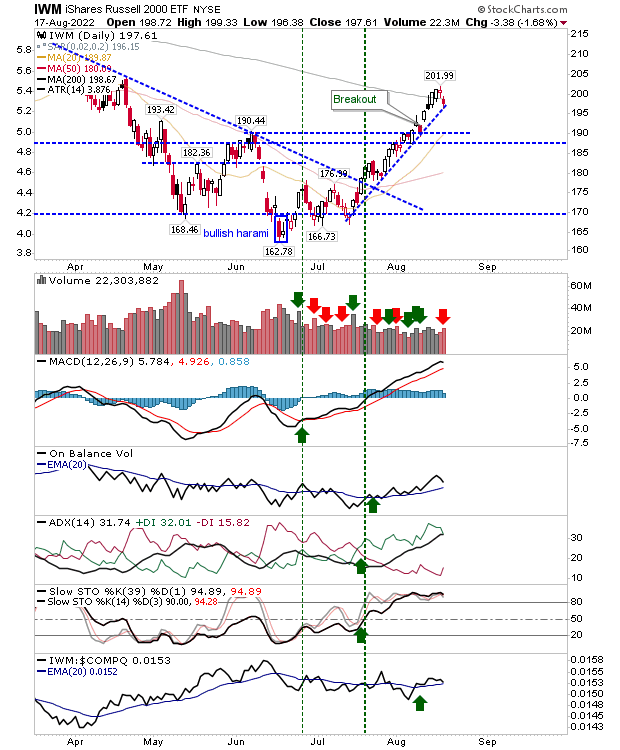
Buyers stepped in to give markets a boost with the S&P going as far as to register an accumulation day.  Today's gains still feel a little early in the game but whatever the cause, the move higher can't be ignored.  This may be part of an a-b-c style, zig-zag move into Fibonacci retracements but much depends on what happens when indices make their second test of 200-day MAs.  The Nasdaq had the biggest gain on the day, but the buying wasn't enough to register an accumulation day and it didn't quite recover its 20-day MA. Aggressive shorts may look to target the 20-day MA but a move back to 13,181 can't be discounted as part of this mini-rally; so keep stops tight if using the 20-day MA for entry.  Note, today's gain did little to recover the 'sell' triggers in the MACD and On-Balance-Volume. 

Markets stalling near 20-day MAs

Image
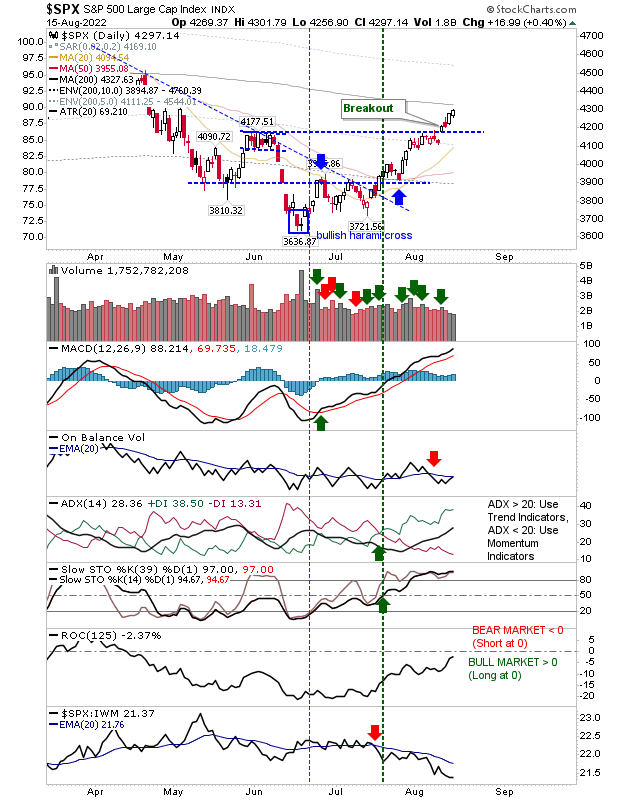
Sellers have near term control of indices with 20-day MAs currently under test. Markets closed today on neutral doji - which gives chance for bulls to put in a low, but a larger pullback would be preferable to firm the strength of June lows.  On the bullish side, the setup over the last two days can be considered as bullish-harami-doji - one of the more reliable bullish reversal patterns; a gap higher tomorrow could see a test of August highs before markets reach their next decision point.  The Russell 2000 is the leading index by relative performance to its peers. However, it's working off a 'sell' in its MACD despite recovering from a 'sell' in On-Balance-Volume.  If there is an index to lead a bounce tomorrow, then look to the Russell 2000 to get the party going.  As an added kicker, it's holding on to June swing highs as support. 

Friday's selling to evolve into support tests with Fibonacci

Image
Bears got more out of Friday to the extent we may get the larger pullback I'm looking for.  We saw something similar in late July that didn't evolve into a larger test of June lows, but now we can look at retracements that could play into Fibonacci retracements.  With Fibonacci retracments we can look at confluence with other support zones - which increases the probability of those price levels playing *as* support.  The Russell 2000 is the index leader.  With Fibonacci layered over the move off June lows the 50-day MA is looking like a natural support test.  This will hurt the current net bullish technical picture, but it should be better for the index in the long run.

Second Day Indecision

Image
We had a rare scenario when the #sectorbreadth analysis for the S&P touched the 90% territory of overboughtness. Not surprising, today's action started to see some easing off highs, although today's set of candlesticks has more in common with a neutral set up - so bulls are reluctant to give up this rally. The lead index - the Russell 2000 - after pushing above its 200-day MA earlier in the week, sellers had managed to push the index back below its 200-day MA.  Despite this loss, technicals remained net bullish. 

S&P on verge of bull cross of 200-day MA

Image
A solid start to the week, albeit on light volume.  Last week saw the bullish cross of the 200-day MA in the Russell 2000.  This week started with the S&P fast approaching its 200-day MA and could be testing it tomorrow.  The S&P is also on the verge of a fresh cross in On-Balance-Volume, although the relative performance of the index to its peers took a step in the other direction - but this shouldn't distract what is positive, bullish action. 

Indices finish week on a high

Image
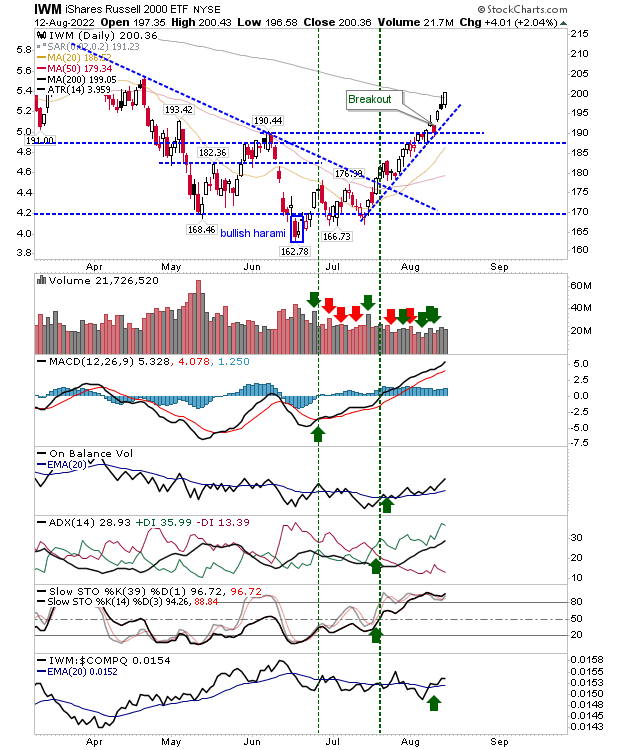
Friday was a solid day for indices with the Russell 2000 ($IWM) doing enough to push through its 200-day MA despite Thursday's bearish candlestick. Small Cap trading volume remained seasonally light, but Friday's buying was enough to retain the uptick in On-Balance-Volume and the relative performance advantage over both the S&P and Nasdaq.  Technicals are net positive as a result.  Aside from the lack of a meaningful pullback (test of support), this is solid action for the index.

S&P sneaks a breakout

Image
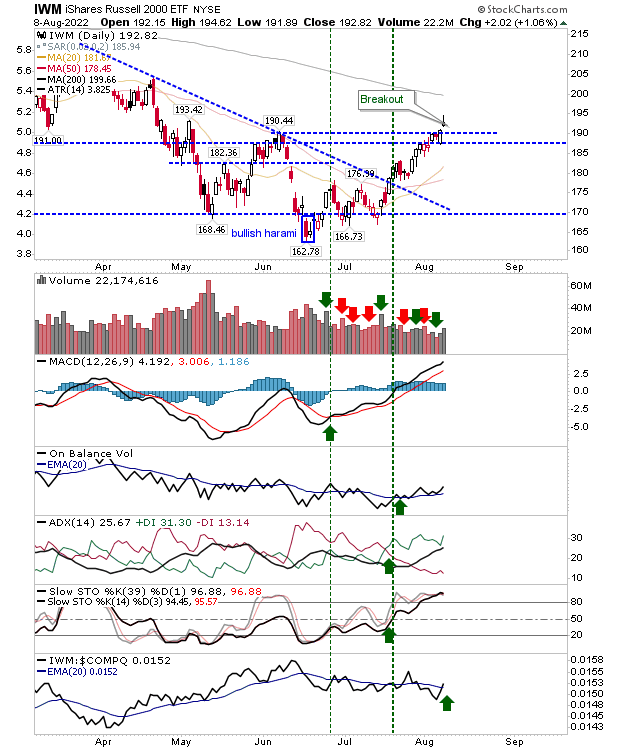
After Monday's reversal candlesticks there were risks of 'bull traps' for the Nasdaq and Russell 2000, but today's gains have managed to negate not just the 'bull trap' risk, but also the bearish inverse hammer and doji from Monday.  In addition, the S&P managed to register a breakout.  The breakout in the S&P came on higher volume accumulation, although On-Balance-Volume remains on a 'sell' trigger.  The index has also accelerated its underperformance relative to the Russell 2000 - although this is more bullish than bearish for the broader market. 

"Inverse Hammer" on Russell 2000 Breakout

Image
It was a mixed day for indices with the first indication of a top for the current advance with reversal candlesticks coming into play off opening gaps in markets. The Russell 2000 is looking the most vulnerable as it finally manages to break past the June swing high. With the 'inverse hammer' we have the risk of a possible gap down Tuesday, which would result in an 'evening star' and a likely "bull trap" - feeding into the likelihood of a larger sell-off. 

200-day MAs come into play for indices

Image
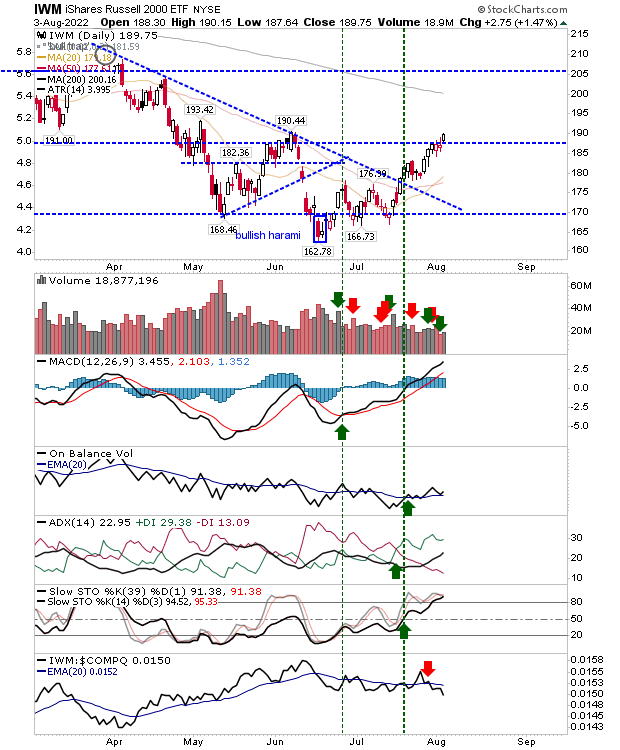
There is still plenty of time before it happens, but given markets are making positive gains beyond the last major swing highs in (May)/June we have to consider the next major test of 200-day MAs.  Even if this proves to be a bear rally, each gain firms up the possibility that the June lows *are* the low for this cyclical bear market (the secular low was March 2009, and the secular bear market ended in 2013 - at least for the S&P). The Nasdaq is leading the indices having handily take out the June swing highs. Accumulation has been climbing with the rising On-Balance-Volume, and the MACD on a new 6-month high.  Stochastics are overbought, which you want to see in a rally (it's when stocastics [39,1] drift out of overbought territory you have to worry).

Rallies continue as volume buying starts to improve

Image
It has been a good summer for indices.  We have seen indices rally towards May-June swing highs in challenges which would help mark new higher highs on intermediate time frames.  On-Balance-Volume has also turned more bullish through July as technicals for the S&P, Nasdaq and Russell 2000 are net bullish. The Russell 2000 is also outperforming the S&P as more speculative growth stocks again attract interest over defensive Large Caps. 

Archive

Show more