Posts

Showing posts from September, 2017

Expanded Russell 2000 Breakout - Nasdaq Ready to Follow

Image
Yesterday saw big gains for the Russell 2000 as it accelerated past breakout support. A large part of this buying was likely driven by short covering but today's defense of those highs is a vote of confidence by buyers who are looking to hold for longer than a few days. The target of 1,560 is the first overbought target to aim for at the 85th percentile rising to 1,637 for the 95th percentile (of historical prices going back to 1987).

Small Caps Take Advantage of Tech Hold Out

Image
It was a day for watching the Nasdaq and Nasdaq 100 but it was the Russell 2000 which took the day's honors. Both the Nasdaq and Nasdaq 100 held on to channel support for another day although it wasn't entirely a decisive defense. Fifty-day MAs are holding but the 'spinning top' candlesticks are a mark of indecisiveness. Volume climbed to register as accumulation.

Can Tech Breakouts Occur From Here?

Image
The squeeze set-up from last week which offered bulls a likely breakout has now fallen back inside the prior consolidation. Bulls now have a decision to make; do they defend the rising channel? Or let prices drift lower and risk a seller capitulation. A channel break at this stage would be very concerning and would open moves to test the June and August swing lows along with the 200-day MA - each a long way from current levels; in addition, a loss of the August swing low would effectively confirm a double-top.

Russell 2000 Hits Its Target

Image
Friday delivered the upside target of 1,450 I was looking for in the Russell 2000. Next will be some follow through in line with the S&P and Dow breakouts, but this will require a resistance break which will be harder than a resistance tag. Technicals are healthy and relative strength is working strongly in Small Caps favour.

Tech Trades Squeeze Stops; Russell 2000 Approaches Resistance

Image
There is a bit of an overreach on today's action as the level of loss was light. However, the much-anticipated breakouts in the Nasdaq and Nasdaq 100 look like they will have to wait a little longer. Both Tech indices saw the squeeze put on tight long stops, but not enough to suggest a panic sell-off is imminent. However, any sell-off has to be watched; losses below the 50-day MA would be concerning. The Nasdaq 100 is looking a little more vulnerable with the MACD trigger 'sell' and +DI/-DI sell' trigger. Look to this index for leads. The index which has been offering the low-key opportunity for bulls is the Russell 2000. It fell just 2 points shy of the 1,450 target I'm looking for, but no reason to suggest it can't make this tomorrow.  Technicals remain healthy. As a footnote, the S&P and Dow did little worthy of attention. Breakouts remain intact and Technicals are sound. For tomorrow, it's a watch-and-wait scenario for Tech indice...

Minor Changes: Yesterday's and Weekend Comments Remain Valid

Image
I don't want to overplay today's action as little changed in the broader scheme of things. Days like today are welcomed and help shape up swing trades for those trading in near term timeframes. The tight doji in the S&P could be used for a swing trade; buy a break of the high/short loss of low - stop on flip side. High whipsaw risk but look for 3:1 risk:reward and maybe trail stops if deciding to go with partial profits.

Semiconductors Breakout

Image
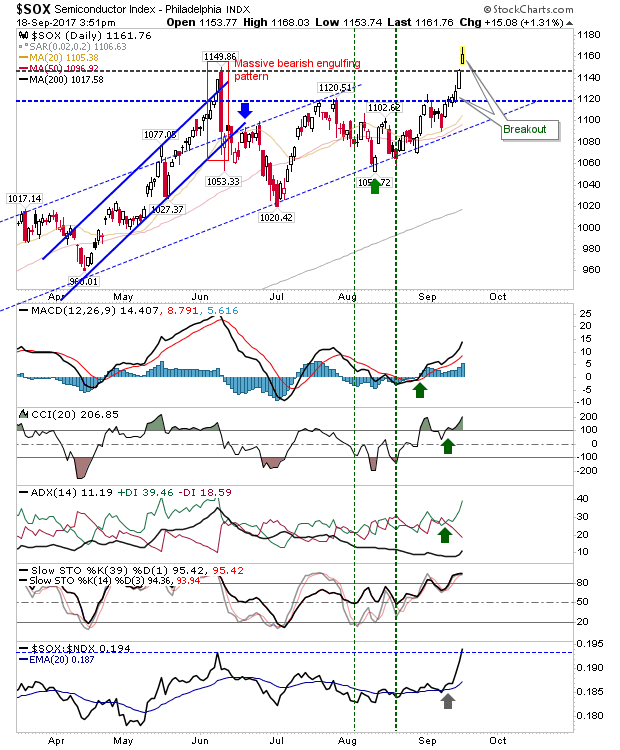
It was somewhat disappointing not to see the Nasdaq and Nasdaq 100 make the break from resistance. However, the Semiconductor index did manage a breakout of 1,150. There was some weakness into the close but the fact the bearish engulfing pattern has been negated means the bearish overhang created by this pattern has been consumed.

Still Waiting For Tech Breakout But Omens Good

Image
Expiration Friday pushed some heavy volume through the markets but the buying wasn't enough to bring about much-anticipated breakouts for the Nasdaq and Nasdaq 100. However, Friday's action suggests all remains good for this to happen early next week. But any drop below 5,900 in the Nasdaq 100, and 6,350 in the Nasdaq has the potential to set up a cascade of (long) stop hits. For the Nasdaq, anyone who took advantage of the channel support hit mid-August (green arrow) will be sitting pretty. I would be looking for a move back to channel resistance.

Dow Follows S&P Breakout

Image
It was a bit of a slow burn day. The S&P held its ground and its breakout without generating significant weakness. However, the Dow managed to post a new closing high although the percentage gain is low and volume was below average.

S&P Breakout Holds

Image
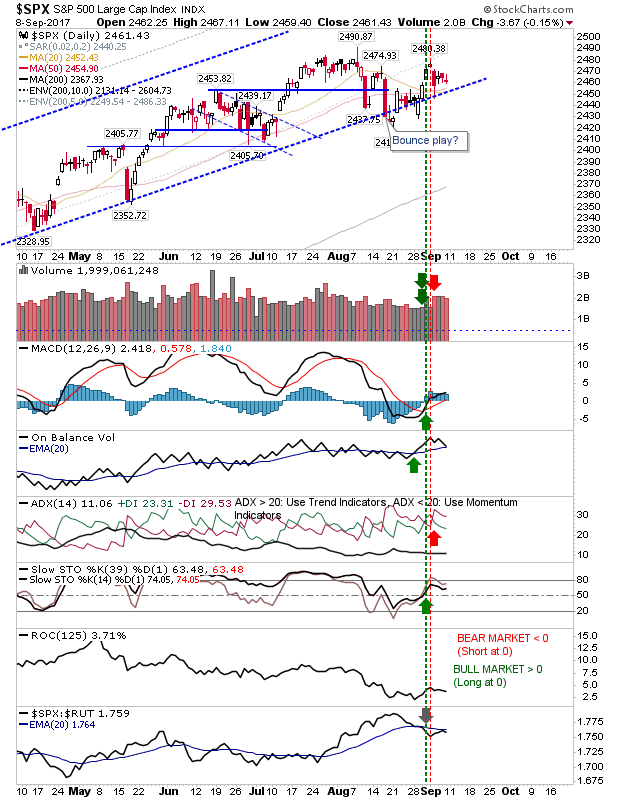
Large Caps and the S&P, in particular, has been leading the broader market with this week's breakout. Technicals are all net bullish as the index looks to mount a challenge of rising channel resistance, which is still some distance away. Current momentum suggests higher prices are favoured and it will take a loss of the channel and a failed retest of the prior high to suggest bears have regained control - so shorts will have to wait longer before they can act.

Respectable Gains Offer Test of Highs

Image
So with markets threatening support they instead gap higher and post further gains.  Today has probably done enough to see markets post new all-time highs while shorts are left with little to work with. The S&P gapped higher with technicals net bullish. Volume was a little disappointing (given the degree of gain) but all of this leaves markets ready for new highs.

Decision Time For Tech and S&P

Image
The coiling setup from last week unwound itself with a move lower; whether markets have blinked and are ready for further losses or if this is just some 'bear trap' remains to be seen. The key test will be whether support from long established rising price channels will hold if such losses continue. The S&P only posted a small loss and some may consider Friday's action a shift in the coil position (use the 2-day high/low to define the trade and stop). However, the rising channel is very close and is in close proximity to the 20-day and 50-day MA.

Markets Coiled and Ready to Strike

Image
After Tuesday's sell off markets have traded into tight coils (inside days) which are traditionally viewed as swing trade opportunities; buy break of high/stop on reverse side + vice versa for a short. The S&P is sitting just above its converging 20-day and 50-day MAs and rising channel support. Technicals are still on the bullish side so I would look for an upside breakout. The Nasdaq has a better coiling setup; today's small doji is an inside day of an inside day. The index has done well to hold above support and is very close to pushing above the 52-week high of 6,460. Technicals are also well placed with plenty of room before they become overbought. Favoured upside. The Russell 2000 hasn't followed the coiling action of other indices, but it is shaping a good pullback which will offer bulls a buying opportunity if it can tag its fast rising 200-day MA. The Dow may be the index to offer shorts something. There was a small loss which accounted for a f...

North Korean Profit Taking

Image
Friday's tight action plus a long weekend of North Korea news left traders skittish and wanting out. However, there wasn't a significant break of support to suggest a rout is imminent but further losses need to be watched. The S&P is resting on rising support but the nature of today's candlestick is not one to suggest tomorrow won't see some follow through lower. The question is whether it will have enough to return above support by the close of business.

Returned To A Bounce Top?

Image
Over the course of my vacation, I have seen markets go from a nascent sell off to a recovery bounce. After four days of gains, markets finished the week slow close to, or at resistance. Shorts may find opportunities in Tech indices. The Nasdaq 100 is at resistance with Friday's doji marking a double top with the July bearish engulfing pattern. Adding to this, there is a potential relative performance switch (to weakness) against Small Caps. And there is natural resistance at 6000 to consider too. Technicals are net bullish but stochastics are overbought so some easing even if just turns into a bullish pullback is perhaps favored. Stops go above 6,010.

Archive

Show more