Posts

Showing posts from June, 2008

Stockcharts.com Weekly review
Image
A torid week for bulls (unless your Spanish!). What did the Stockcharters see in it all? Maurice Walker has his weekend summary up on his public Stockchart list. He notes the decline in PCE inflation for the year. I would disagree with his analysis we are not in a bear market; this is a secular bear market which kicked off in 2000, with a cyclical bear market from Oct 07 based on action of breadth indicators. As a sidenote, Ireland is in offical recession with the latest GDP at -1.5%; given the strong business relationship with the U.S. it may have some relevance (or it may not - but given Intel, Dell etc have their European bases in Ireland it's not good news). But here is his opinion because it's (always) worth reading: Sorry for posting so late in the weekend but I was feeling ill, and no, not because of the market. We have done very nicely in our short positions taken on May 20, along with the swing trades made back and forth along the way. This week we found out that inf

Zignals: S&P Moving Average Behaviour

My latest post on S&P Moving Average Behaviour is available on Zignals . Dr. Declan Fallon, Senior Market Technician, Zignals.com the free stock alerts, market alerts and stock charts website

Oh! Where's the bounce?

Image
A swathe of bad news and oil price hikes sent any 'will-I-won't-I' buyers scurrying to the hills, taking a few bag holders with them. The Fed bounce which was so nicely teed up was stomped into the ground. The pressure of higher oil prices will influence action today, but I would be surprised if markets don't close around yesterday's lows with some volatilty thrown in during the day. Futures are flat , so there is no immediate downside pressure from the current oil price. The question for bulls is if they can regain all of yesterday's losses, will that effort exhaust them to the extent prices drift lower to new lows? The concern (as I see it) was another poor response from the volatilty index. Volatilty doesn't have to spike higher to mark a bottom, but yesterday was the kind of day where a spike would have at least suggested a bottom was in place. The Dow chucked a gut as money flow rushed out because of GM. But it should be oversold enough to see a p

Disappointing day for bulls

Image
The late afternoon sell off will have done little to calm bull's nerves. The prior two days had set things nicely for a Fed rally - enough to see a push to the 20-day MAs at least. But the concern now will be for further weakness off the open and a fresh push down. The volatility index hasn't indicated any wave of fear - but a failed Fed rally might be the cue to force weak hands to sell and put in place a stronger bottom. Technicals of the VIX are at best neutral with the volatility index caught between 50-day and 200-day MAs. Whether such technical measures are relevant here is debatable by some, but it does suggest a measure of complacency compared to January through April. Although there is far more fear now than there was during the 2005-2007 "Golden Years" Get the Fallond Newsletter Dr. Declan Fallon, Senior Market Technician, Zignals.com the free stock alerts, market alerts and stock charts website

Nasdaq McClellan Oscillator at reversal lows

Image
Extreme oversold levels in the McClellan Oscillator have marked good short term bottoms, but a more significant bottom requires confirmation from other breadth and technical indicators. The same picture plays across the Nasdaq and NYSE. With the Fed decision due today, taken with the relative position of these indicators, the short term response to the Fed reaction/statement should be favourable (but not necessarily so!). Whether it can sustain a positive response will depend on how much buying volume can be pumped into the market: Get the Fallond Newsletter Dr. Declan Fallon, Senior Market Technician, Zignals.com the free stock alerts, market alerts and stock charts website

Dow looks ready to pounce

Image
Futures indicate a likely flat open for Tuesday (ehhh...the Dow futures has dropped 40 points since I started writing this....), tolerating weak guidance from UPS . Technicals are shaping up a little more positively for the Dow, although it has much ground to make up to get back to its 200-day MA. The 50-day MA would be an optimistic target with short term traders looking to jump ship at the 20-day MA. The Dow bullish percents give the best indication a bottom is in place with its flat-line action. Prior flat-lines, particularly in conjunction with a falling Dow, have been decent long side entry points. The current situation would suggest a similar long-side play is available. When one looks at the Dow there are indications a bounce is on the cards. The bullish harami cross is one of the most consistent bullish reversal candlesticks; a stop on a break of the 2-day low gives adequate protection to the downside with an entry on a break of yesterday's high. Oversold stochastics lend

Stockcharts.com weekly review

Image
Friday's action put a dampner on the week's action. How did the Stockcharters see it? A welcome boost for Maurice Walker as his list ranks top amongst the market commentators. He saw multiple sell triggers on Friday's action: We got a wonderful sell signal on May 20, as the DJIA broke its intermediate trendline which was confirmed that very day with a bearish direction indicator (DI) cross on the ADX indicator and bearish confirmation on the MACD. The following day on May 21 the S&P 500 broke down and it got a bearish DI cross. Moreover, on May 26 the Aroon gave a sell signal on the DJIA. The S&P's 500 sell signal came on June 2, as the first right shoulder formed on the S&P 500 near 1400. We also got excellent candlestick reversals at the 200-day SMA , as shooting star reversals appeared on both the DJIA and the S&P 500 on May 19. Because we listened to our indicators, the ultrashort position trades we entered on May 20, have now reaped the rewards, wi

New KIVA loans

Three new loans come into play. The first two loans are from subscription contributions by H. Paul and R. Buffham . The third is from a Scratchback purchase by Informed Trades . I would like to thank all supporters of my research for their hard earned funds. The first loan goes to Tran Thi Thuy in Vietnam: Mrs. Tran Thi Thuy, 34 years old, joined TYM since 2001. Her husband is a kind man who always help out his wife with the housework after coming home from work. He is currently working as a handyman, earning around 1.5 million VND per month. They already have 3 children, all going to school at the moment. Mrs. Thuy work as a tailor and all of her loans had been invested into this business. This cycle, she would like to borrow 10 million VND to invest into this shop. Her family monthly income is around 4 millions VND. The second is to the Xejuyu Concepcion group of entrepreneurs in Guatemala: The women of the Xejuyu Concepción Group come from very humble backgrounds. They live

Zignals strategy lab: 5-day EMA x 10-day EMA

I have posted my latest strategy lab over on the Zignals blog .

S&P near a bottom?

Image
Bears piled pressure on with some solid selling. But there is an inkling for long term support in the S&P. Leading the challenge is the Percentage of S&P stocks trading below its 50-day MA. It should be noted this is a weekly chart, so the time frame for a bottom is weeks - not days. The other watch area is the mid-line Bollinger band which kept things sweet from the 1980's up to the millenium collapse. Bear phases (with respect to the EMAs) have not been very long with the exception of the 2000-2003 collapse. If the mid-line breaks it would set up a much more bearish scenario and the likelihood of a push to the lower Bollinger band, currently lurking around 1,078. Watch the breadth indicator for leads and note where it's bottom correlates to the position of the S&P at that time. The mid-BB band is at 1,318. Get the Fallond Newsletter Dr. Declan Fallon, Senior Market Technician, Zignals.com the free stock alerts, market alerts and stock charts website

ANWR: To drill or not to drill

I wrote this as a comment on Econobrowser's piece on drilling in ANWR , which I have decided to publish as a blog post given its length. Drilling ANWR now will do little to change anything. Why not leverage it for the future? It's a pot of gold which is only going to get richer as world oil supply decreases. The Middle East holds the cards and there is little incentive for the Saudi's and Co. to add supply to the market when restricting that supply only increases revenue. Only 'indirect' threats to soverignity from disgruntled (and more powerful) consumers might force their hand. But as events in Iraq have shown this threat is largely empty and only emboldens Middle Eastern suppliers to be more restrictive in the quantity of oil made available to the world. Opening ANWR now isn't going to alter demand for Middle Eastern oil. From an environmental perspective, delaying drilling of ANWR will allow time for the development of more environmentally tolerant drilling

Anyone's game

Image
Future's look set for a weak open, but it still isn't clear who has the edge. The last few days have seen low volume action on both the bull and bear side. The 50-day and 200-day moving averages look to be the watch point for tech and small cap indices The small caps are getting squeezed between the 50-day and 200-day MAs; as TraderMike calls a "no-mans" land of trading. While Large caps have the issue of January/March lows to look down to, and the 50-day MAs above: The S&P has a little wiggle room at April-May lows: Tech averages climbed into "No-mans" land; the March-May support trendline long since gone: Get the Fallond Newsletter Dr. Declan Fallon, Senior Market Technician, Zignals.com the free stock alerts, market alerts and stock charts website

Steve Madden (SHOO)

Image
Steve Madden, Ltd ( SHOO ) was a stock which I had trawled from one of my stock scans. It is showing some interesting form with Monday's doji just above the 20-day MA. This action followed a retracement from the one-day surge triggered by positive earnings . Technicals are a little bit of a mixed bag with a fresh MACD 'sell' on a flatline on-balance-volume trend. Stochastics have also fallen out from overbought conditions - considered bearish. However, bull trend strength has improved sharply with the ADX at a healthy 31.74 [+DI > -DI]. Also positive was the bullish cross of the 200-day MA by the 20-day MA and the upcoming "Golden Cross" between the 200-day MA and 50-day MA. The point-n-figure chart has a target of $27 from the May 30th double top breakout, but this will likely turn into a conservative target if it can clear $24 and complete a bullish head-and-shoulder reversal pattern, bringing the target closer to $34. Options players shows a fair degree of

Stockcharts.com Weekly review

Image
A busy week left bulls sweating. How did the Stockcharters see it? Joe Reed 's Oil weekly chart is interesting for the coiled spring (not highlighted) in his Full Stochastic setting; there is only room for one outcome - which should see opportunity on the short side on the daily chart: Note the earlier failed break in Exxon; stocks lead commodities... Maurice Walker has his epic summary on the week; good to see him move up the rankings - his list is one of the best maintained of the Public Stockchart lists, remember to 'Vote For Him!' if you like his list the best (otherwise, vote for me! ): My favorite artist by far is Vincent Van Gogh. It seems that there is a bit of an uproar in the art world these days concerning the alleged last painting of Dutch artist Vincent Van Gogh. Recently, a painting was discover among the possessions of a Greek resistance fighter, that has been attributed to Van Gogh. It is believed that this is the third painting, that Van Gogh made of his p

Zignals: Alerts

I have posted another two strategy articles following the launch of Zignals Alerts . The first looks at a system trading breaks of 20-day high/lows. The second looks at a system which trades a break of 20-day highs and holds for 30,60, or 90 days. Dr. Declan Fallon, Senior Market Technician, Zignals.com the free stock alerts, market alerts and stock charts website

New KIVA loans

I have a few more redemptions to allocate to new loans . The following individuals were recipients of these funds: Lomuku 2004-a-Group : Veronica Siko, the group leader, has a business selling flour and she has applied for this loan in order to purchase more flour to resell. Veronica is 30 yearsold, married and has four children between the ages of 6 and 20. Her husband is a builder and her children of school age attend school. Each week, Veronica makes approximately 100 Sudanese pounds in profits. Veronica is joined in her small group by Joice Kwaje, Tereza Siama, Magreat Festo, and Cicilia Achola. Joice Kwaje sells bread and wants to expand her business. Tereza Siama currently has a business selling bread and cooking oil at the market but would use this loan to build a hotel. Magreat Festo operates a business selling tea at a restaurant and hopes to expand the restaurant. Cicilia Achola is currently in the business of selling food at a hotel but has applied for this loan in order to

Timmay Marathon

Timothy Sykes is planning an 8 hr Marathon of his Livestocks show in honor of Friday the 13th. You can catch his show here or on his site .

Ouch!

Image
Prior to yesterday's meltdown, VixandMore had posted a piece on the VXO and RVX relationship, suggesting that an intermediate bottom was likely in place for the S&P. If this indeed is the case then this morning's open is likely to provide some bargain hunting for such a long trade - probably enough to sneak a 10% return. The S&P is fast approaching a layer of support around the minor March and April reaction lows - so a gap down into the space would be an aggressive long opportunity. Stochastics are already nicely oversold, so even without the gap it maybe worthy of a pop at the open. It was interesting to see a tepid response from volatility in the face of S&P selling: Get the Fallond Newsletter Dr. Declan Fallon, Senior Market Technician, Zignals.com the free stock alerts, market alerts and stock charts website

Markets and the Transports

Image
Traderr's Narrative took a good look at market internals to get a feel for the current market. His conclusion was that markets were in a bit of limbo; bearish - but not bearish enough to suggest a wash-out of weak hands. HeadlineCharts suggests Financials are approaching a bottom while Tech strength remains firm, even in the face of recent selling. But the New high/New low count for the Nasdaq was worrisome if you are a bull. I do think tech will succumb to increased weakness in the semiconductors after it breached May reaction lows, given the latter index has done much of the leg work since March to keep the broader rally afloat. However, Nasdaq , Nasdaq 100 and the semiconductors all closed at major moving average support (50-day or 200-day MAs), so if they were to bounce Wednesday would be a good day for it. I'll be watching the Transports closely. The index may have formed a diamond top. A move to the 50-day MA would constitute a break of this pattern, and a bre

Ten year treasury yields set to pop?

Image
The ten-year tresury yield, like the indices, is knocking around an important juncture which will likely set the tone for the rest of the year. The 200-day MA has contained a higher run, but converged support of the 20-day MA and the January-March double bottom is angling to push the yield higher. There is good technical support in the ADX and stochastics, but the MACD trigger line has flat-lined throughout May. Given the technical picture, the future outlook favors higher yields and lower bond prices. Get the Fallond Newsletter Dr. Declan Fallon, Senior Market Technician, Zignals.com the free stock alerts, market alerts and stock charts website

Watch Dow for leads

Image
Friday was a whopping hit on the averages, but the Dow really took it on the chin. The Dow Bullish Percents dropped to 40%, leaving them at the 38% retracement line for the Mar-May advance. Another few points lost and a complete retrace to March lows is likely. Although the Dow is hardly representative of the market as a whole it does give an inkling as to what might happen for its cousin the S&P. The Dow is precariously close to another run on January-March lows; with my earlier measured move target of 12,055 likely a day or two away. Consequently, it could mean greater pain for the S&P: Get the Fallond Newsletter Dr. Declan Fallon, Senior Market Technician, Zignals.com the free stock alerts, market alerts and stock charts website

Stockcharts.com weekly review

Image
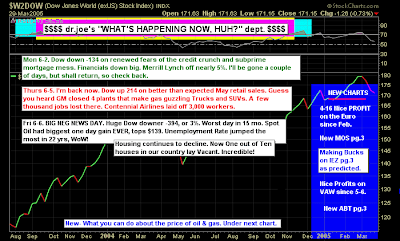
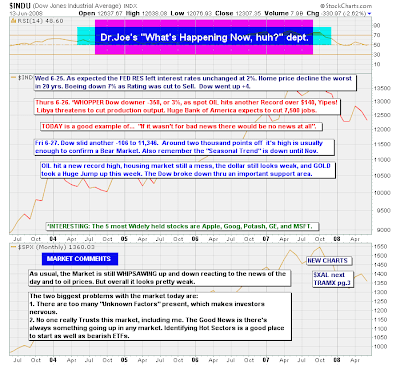
Oil took the headlines by the close of the week. Did the Stockcharters have anything to add? Dr. Joe noted the GM closures, and of course the gain in oil prices. But one cannot like the false breakout in Exxon; this is a bull trap and would be bad for oil prices (but good for the consumer): Joe's Dow chart doesn't spell much fun for the near future: Maurice Walker sees deception: Investors retreated from the stock market this week, because the future state of the economy appears to be somewhat ambiguous. The bad news bears were out playing on peoples fears, as they are once again are attempting to create the illusion of a recession. These prophets of doom and gloom are once again prophesying an economic tsunami. The financial media is deliberately intending to mislead the public of the facts, purposely avoiding clarity and creating a paradigm of fear. And fear can motivate you to action, but it can also paralyze people, and that is exactly what we witnessed during Friday'

Archive

Show more