Posts

Showing posts from June, 2010

Daily Market Commentary: Weakness Continues

Image
Yesterday's huge losses had the potential for a counter rally but after a weak attempt to regain support, sellers returned in the last hour of trading. With losses over 1% there is no doubt support has broken. The S&P is very close to a "Death Cross" between 50-day and 200-day MAs although today's selling volume was light. ($SPX) via StockCharts.com Will the former resistance line help as support for the Nasdaq? Buy the open and use a 1% stop - sell on test of 20-day MA. ($COMPQ) via StockCharts.com The Dow is offering a similar buying opportunity to the Nasdaq. ($INDU) via StockCharts.com The Russell 2000 failed to cling on to support and followed the other indices lower. But if other indices rally tomorrow will it create a 'Bear Trap'? ($RUT) via StockCharts.com It's hard to say whether the buying opportunities available in the Nasdaq and Dow will prove fruitful given a similar test in the S&P failed. A series of sharp down day...

Daily Market Commentary: Powerful Gaps Down

Image
Market confidence fell alongside that of the consumer , leaving markets reeling with severe technical damage. The S&P posted a new closing low as support cracked on higher volume, negating the last point of support from declining trendlines. The best hope for bulls is a close above 1,049 to produce a counter 'bear trap'. Technicals are net negative following the MACD trigger 'sell' with confirmed distribution. ($SPX) via StockCharts.com The Nasdaq gapped powerfully lower, taking it below 2,152 support (the new threshold for a 'bear trap'). Technicals are net negative following the MACD trigger 'sell'. Volume registered as a confirmed distribution day but given the extent of the loss it could have been higher. ($COMPQ) via StockCharts.com Small Caps posted a big percentage loss but managed to hold within range of June low support. Technicals turned sour with a break of the CCI bullish divergence and a MACD trigger 'sell'. Given the ac...

Daily Market Commentary: Bulls Afraid to Buy

Image
Friday's heavier volume buying in the S&P did not lead to upside follow through. The 20-day MA has started to tick down which is usually the start of something worse; will 1,088 (20-day MA) be sold off on a challenge Tuesday? The MACD is close to a 'sell' trigger but it well below the bullish zero line. ($SPX) via StockCharts.com The Nasdaq remained pegged by converged 20-day and 200-day MAs with a technical picture which is a mirror image (and with the same issues) as the S&P ($COMPQ) via StockCharts.com The Russell 2000 is holding on to its 200-day MA but is oddly pressured by the 20-day MA; bulls has made a good stand at the 200-day MA on Friday so the lack of some follow through is a concern. CCI holds rising support. ($RUT) via StockCharts.com Much rides on the semiconductor index for the Nasdaq and Nasdaq 100. While it holds above the 200-day MA it is on the verge of turning net negative technically. ($SOX) via StockCharts.com Although breadth ...

Weekly Review of Stockcharts.com Publisher Charts

Image
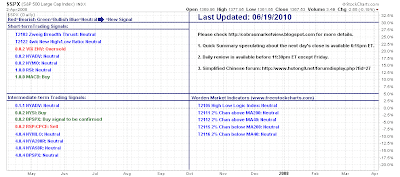
A week where markets suffered before finding some legs on Friday. We open with Richard Lehman's ( Channelist ) weekend summary 6/27 -- Most indexes remain in green ST upchannels but are still in the red minis inside them. Once the red minis break, a bounce can ensue, but the long term downtrend looms heavy over any bounces here. The 6/27 issue of The Channelist Newsletter is out today. More charts. More commentary. Less than $20/month. See www.Channelist.com for details. 6/24 -- The red minis have been perfect, but are now approaching larger green support lines. Time to begin covering shorts and going long for the trade. SPX has pretty much hit the green and XLE actually overshot and should be ready to bounce. Also, VXX hit a line and may back off. However, the one year charts look VERY ominous, folks -- a big downchannel and stochastics peaking. Treat any bounce upward as countertrend. 6/23 -- Red minis continued downward. Gold and oil broke their minis, but could be at...

Latest KIVA loans

Image
Five more loans to bring the total of projects supported to 168 . All of these loans were funded by repayments from other KIVA participants, but you can add to this by buying a Scratchback link from the link box on the right and I will use this towards a new KIVA loan. The most recent purchase was by Best Trading System

Daily Market Commentary: Bears Remind Bulls They're Back

Image
It was set up for a bull defense from key moving averages, but in the end it was bears who grabbed the market by the scruff of the neck. The S&P has come back to a backtest of breakout support - a good opportunity for buyers to make another stand - especially after four days of selling. ($SPX) via StockCharts.com The Nasdaq was similarly pained; cracking through both 20-day and 200-day MAs on heavier volume distribution. It hasn't the proximity to backtest support to suggest a positive reaction tomorrow, but four days of selling will make it hard to push it to five given prices have dropped into the scrappy late May-early June trading range. A day of indecision perhaps? ($COMPQ) via StockCharts.com Small Caps dropped down and just below the 200-day MA. The only index with a conventional moving average and backtest support to work. The best longside opportunity for the next few trading days? ($RUT) via StockCharts.com The Nasdaq 100 was a little mixed. The 200-day MA...

Daily Market Commentary: Markets Hold On

Image
It was a mixed day for the markets. Volume picked up as the 20-day MA held as support for the S&P. Wednesday's spinning top implied indecision but it was probably a better day for the bulls given volume was not accompanied by a more concerted point selloff. ($SPX) via StockCharts.com The Nasdaq had a quieter day, a tight trading day held 200-day MA support. ($COMPQ) via StockCharts.com As did Small Caps ($RUT) via StockCharts.com The Nasdaq 100 is interestingly positioned at former resistance turned support; looks an aggressive 'buy' for Thursday. ($NDX) via StockCharts.com While bulls have lost some of the momentum from the June bottom rally it looks like Thursday will give them an opportunity to offer a defense at key moving averages. Follow Me on Twitter Build a Trading Strategy in Zignals; Read how and earn real money (once out of Beta) in this PDF. Subscribe to one of 58 trading strategies covering US, UK, Canada, Forex, ETFs, Frankfurt, A...

Daily Market Commentary: Breakout Failures

Image
Yesterday's weak end-of-day followed through to the downside, knocking out breakout support for many of the indices and 200-day MAs too (Large Caps). If there was some compensation it was the low volume associated with the selling. The selling wasn't enough to prevent a 'sell' trigger for on-balance-volume with the directional index close to a bearish cross. ($SPX) via StockCharts.com The Nasdaq hasn't quite broken its 200-day MA and is in fact very close to a bull cross of the 200-day MA by the 20-day MA; 2,249 is the watch area. ($COMPQ) via StockCharts.com The Russell 2000 had one of the biggest losses on the day, but it is still well above its 200-day MA at 636.7 ($RUT) via StockCharts.com Finally, the semiconductor index went from net bullish (technically) to an early 'sell' trigger. There is plenty of wiggle room for bulls to work with, first of which is the 20-day MA. ($SOX) via StockCharts.com For Wednesday look for bulls to rally b...

Daily Market Commentary: Plenty of Volatility

Image
Troubling times for the market after Monday morning enthusiasm gave way to skepticism on today's longest day. The S&P was repelled by the 50-day MA overhead but did not break below its 200-day MA or 1,100 support. Also, on-balance-volume eeked out a 'buy' trigger - a sign of bullish accumulation. ($SPX) via StockCharts.com The Nasdaq suffered a large bearish engulfing pattern at overbought stochastics [14,3]. The 50-day MA also plays as resistance. ($COMPQ) via StockCharts.com Small Caps also finished with a bearish engulfing pattern but with some wiggle room to both 50-day MA resistance and 200-day MA support. Odds favour a move back to the 200-day MA. ($RUT) via StockCharts.com The Dow closed with a nasty gravestone doji which pinged off the 50-day MA. Not much room down to the 200-day MA. This could be the first index to blink. ($INDU) via StockCharts.com Monday's action suggest Tuesday will see a continuation of the weakness. Bulls can't assu...

Weekly Review of Stockcharts.com Publisher Charts

Image
US Futures are suggesting a bright start for Monday so with that what had the Stockcharters to say about last week? We open with Richard Lehman of the Channelist . He talks above gains lasting another couple of day before things get toasty (he also plugs his new newseletter!). 6/20 -- First, Happy Fathers Day, fellow Dads! Second, THE CHANNELIST NEWSLETTER is now available by subscription. The only way I can continue doing this much work is to charge a nominal amount. Please go to www.Channelist.com for info and to subscribe. This week's letter will be available today. Third, it looks like the markets could squeeze out another up day or two, but there is big resistance to going much further in both short and long term channels without a pull-back. Momentum is waning and stochastics are in or approaching overbought extremes. But there is a bullish long term case that says the entire correction is over -- I illustrate this possibility in the Channelist this weekend. 6/17 -...

Archive

Show more